


Abstract
Pancreatic ductal adenocarcinoma (PDAC) is referred to as a silent killer due to the lack of clear symptoms, a lack of early detection methods, and a high frequency of metastasis at diagnosis. In addition, pancreatic cancer is remarkably resistant to chemotherapy, and clinical treatment options remain limited. The tumor microenvironment (TME) and associated factors are important determinants of metastatic capacity and drug resistance. Here, oncostatin M (OSM), an IL6 cytokine family member, was identified as an important driver of mesenchymal and cancer stem cell (CSC) phenotypes. Furthermore, the generation of cells that harbor mesenchymal/CSC properties following OSM exposure resulted in enhanced tumorigenicity, increased metastasis, and resistance to gemcitabine. OSM induced the expression of ZEB1, Snail (SNAI1), and OSM receptor (OSMR), engaging a positive feedback loop to potentiate the mesenchymal/CSC program. Suppression of JAK1/2 by ruxolitinib prevented STAT3-mediated transcription of ZEB1, SNAI1 and OSMR, as well as the emergence of a mesenchymal/CSC phenotype. Likewise, ZEB1 silencing, by shRNA-mediated knockdown, in OSM-driven mesenchymal/CSC reverted the phenotype back to an epithelial/non-CSC state. Importantly, the generation of cells with mesenchymal/CSC properties was unique to OSM, and not observed following IL6 exposure, implicating OSMR and downstream effector signaling as a distinct target in PDAC. Overall, these data demonstrate the capacity of OSM to regulate an epithelial–mesenchymal transition (EMT)/CSC plasticity program that promotes tumorigenic properties.
Implications: Therapeutic targeting the OSM/OSMR axis within the TME may prevent or reverse the aggressive mesenchymal and CSC phenotypes associated with poor outcomes in patients with PDAC. Mol Cancer Res; 15(4); 478–88. ©2017 AACR.
This article is featured in Highlights of This Issue,
Introduction
Pancreatic ductal adenocarcinoma (PDAC) has been referred to as a silent killer due to the lack of clear symptoms, and the lack of early detection methods. In the great majority of cases, patients present with advanced disease that has already metastasized. In addition, pancreatic cancer cells are remarkably resistant to chemotherapy, and additional treatment options remain limited. As a result, the 5-year survival rate is approximately 5% (1), with nearly as many patients dying each year of pancreatic cancer as are diagnosed. The problem lies, in part, due to the early cellular dissemination of PDAC cells to distant organs, which can precede primary tumor formation (2). This highly invasive characteristic of PDAC (3) is largely associated with the gain of mesenchymal properties by the ductal epithelial cells, indicative of an epithelial–mesenchymal transition (EMT; ref. 2). Expression of key transcription factors capable of driving EMT, such as ZEB1, Snail (SNAI1), and TWIST1/2, initiate the repression of tight cell–cell protein interactions (claudin, occludin, ZO1, and E-Cadherin), ultimately releasing cells to invade neighboring tissue (4–6). These invasive and motile properties allow the tumor cells to escape a primary site of disease, systemically disseminate, and seed metastases at secondary sites. Concomitant with this transition to an invasive, mesenchymal phenotype is the acquisition of cancer stem cells (CSC) properties responsible for enhanced tumorigenicity and acquired resistance to therapeutic drugs (7–11).
Emerging evidence suggests a pivotal role for the tumor microenvironment (TME) in promoting epithelial–mesenchymal plasticity (E–M plasticity) and the acquisition of CSC properties (12–15). The TME is composed of secreted factors emanating from infiltrating immune components, fibroblasts, and other stromal cells. Notably, severe immune infiltration and stromal fibrosis (desmoplasia) is observed in early and late stages of PDAC (16, 17), and enhances tumor growth/survival (18). Identifying key mediators within the TME that engage mesenchymal/CSC plasticity will be important for developing effective therapeutic targets for the treatment of PDAC.
Oncostatin M (OSM), an IL6 family cytokine, is elevated in the serum of PDAC patients relative to healthy controls (19). Moreover, tumor-associated macrophages (at both primary and metastatic tumors) exhibit increased secretion of OSM in murine PDAC models (20). OSM signals through a gp130/OSM receptor (OSMR) complex, which activates the JAK/STAT3 pathway. STAT3 promotes gene expression both as a transcription factor as well as by epigenetic mechanisms, and is critical in inducing inflammation and cancer. Furthermore, constitutive activation of oncogenic STAT3 signaling promotes tumorigenesis and is associated with poor outcomes in PDAC (21, 22). Importantly, OSM can more potently activate STAT3 relative to other IL6 family members (23, 24). However, very little is known about the biological effects of OSM-induced STAT3 in PDAC. Here, we examine the ability of OSM to promote the emergence of mesenchymal/CSC properties in PDAC. We demonstrate that OSM is capable of inducing a potent EMT/CSC program that enhances tumorigenic potential, cell motility, invasiveness, and metastasis. Importantly, OSM conferred resistance to gemcitabine, a current first-line therapy for PDAC. We propose that targeting OSM within the TME or OSM signaling within the tumor is likely to reduce the aggressive, metastatic and tumorigenic properties associated with PDAC, thereby improving patient response to therapy and extending patient survival.
Materials and Methods
Cell culture
All PDAC cell lines (HPAC, Panc 04.03, Panc 08.13, Panc 05.04) were obtained from ATCC and grown in a humidified atmosphere containing 5% CO2 at 37°C. PDAC cell line HPAC and human fibroblasts were grown in DMEM/F12 (#10-092-CV; Corning) with 10% FCS (#S11150; Atlanta Biologicals), 0.005 mg/mL of human transferrin (#T2252; Sigma Aldrich), 10 ng/mL of human epidermal growth factor (#01-107; Millipore), 0.002 mg/mL of human insulin (#I9278; Sigma Aldrich), and 40 ng/mL of hydrocortisone (#H4001; Sigma Aldrich). Panc 04.03 and Panc 08.13 cells were grown in RPMI1640 (#SH30027.01; Hyclone) with 15% FBS (#S11150; Atlanta Biologicals). Panc 05.04 cells were grown in RPMI1640 (#SH30027.02; Hyclone) with 15% FBS (#S11150; Atlanta Biologicals) and 0.2 U/mL of human Insulin (#I9278; Sigma Aldrich). Treatments were done either with 10 ng/mL human recombinant Oncostatin M (OSM; #OSM01- 13; DAPCEL), 10 ng/mL IL6, or 10 μmol/L ruxolitinib (#R-6688; LC Laboratories). All short-term treatments were performed as denoted in the figure legend; all long-term treatments were given at each medium change unless denoted otherwise (∼48 hours). Human fibroblast cultures were established from the digestion medium filtrate of primary reduction mammoplasty tissue as described previously (25). The fibroblast-containing filtrate was plated into DMEM (#10-013-CV; Corning) with 10% FBS (#S11150; Atlanta Biologicals) and immortalized using pBabe-Puro-hTERT.
Microscopy, Western blot analysis, and quantitative real-time RT-PCR
Bright-field images were captured at 40× and 200× on a Nikon Eclipse TE2000-S using MetaMorph (Molecular Devices). Western blots were conducted as described previously (12). Primary antibodies used were actin (#MS-1295-P; Thermo Scientific), E-cadherin (#sc-27191; Santa Cruz Biotechnology, #3195; Cell Signaling Technology), Snail (#3879; Cell Signaling Technology), phosphorylated STAT3Y705 (#9145; Cell Signaling Technology), STAT3 (#9139; Cell Signaling Technology), and ZEB1 (#3396; Cell Signaling Technology). Secondary antibodies used were HRP-linked anti-mouse (#7076; Cell Signaling Technology) and HRP-linked anti-rabbit (#7074; Cell Signaling Technology). For quantitative real-time RT-PCR (qPCR), total RNA was isolated as described previously (12). RNA (1 μg) was reverse transcribed by iScript cDNA Synthesis Kit (#170-8891; Bio-Rad). Gene expression was identified using iQ SYBR Green Supermix (#170-8880; Bio-Rad) and a CFX96 thermocycler (Bio-Rad). All samples were normalized to GAPDH expression, and error bars represent ± SEM for a representative experiment performed in triplicate. A two-tailed unpaired Student t test was performed to determine significance (*, P ≤ 0.05; **, P ≤ 0.01; ***, P ≤ 0.001; ****, P ≤ 0.0001). Primer sequences were as follows: OSMR forward: 5′-TCCCAATACCACAAGCACAG-3′; OSMR reverse: 5′-GCAAGTTCCTGAGAGTATCCTG-3′; SNAI1 forward: 5′-GGAAGCCTAACTACAGCGAG-3′; SNAI1 reverse: 5′-CAGAGTCCCAGATGAGCATTG-3′; ZEB1 forward: 5′-ACCCTTGAAAGTGATCCAGC-3′; ZEB1 reverse: 5′-CATTCCATTTTCTGTCTTCCGC-3′; GAPDH forward: 5′-TGCACCACCAACTGCTTAGC-3′; GAPDH reverse: 5′-GGCATGGACTGTGGTCATGAG-3′; CDH1 forward: 5′-CCCAATACATCTCCCTTCACAG-3′; CDH1 reverse: 5′-CCACCTCTAAGGCCATCTTTG-3′.
Flow cytometry, migration, and growth assays
For flow cytometry and FACS, HPAC cells (∼1–2 × 10⁶) were stained with anti-human CD44 APC (clone BJ18; #338806; BioLegend), anti-human CD24 PE (clone ML5; #311106; BioLegend), and anti-human CD133 VioBright FITC (clone AC133; #130-105-225; Miltenyi Biotec). Cells were analyzed using a BD LSRII and FACSDiva software version 6.2. Migration assays were performed using the live cell IncuCyte ZOOM imaging system (Essen BioScience). Briefly, HPAC cells (1,000 cells/well) were suspended in DMEM/F-12 containing 0.5% FBS and were seeded onto 96-well ClearView-Chemotaxis plates with 8-mm pores. Wherever indicated, plates were coated with 50 μg/mL Matrigel, 5 μg/mL collagen, or 5 μg/mL fibronectin, prior to the seeding of the cells. The plates were incubated and imaged over the indicated time points. Cells migrating to the bottom chamber across the pores were imaged and quantified. Similarly, growth assays were performed using 96-well tissue culture dishes seeded with HPAC-VEC, HPAC-OSM, parental HPAC, or OSM-treated HPAC (day 7) cells (2,000 cells/well). Each well was imaged at regular intervals to determine confluence over time.
Mouse xenografts
Athymic NCr (nude) and NSG mice were bred and maintained at the Athymic Animal and Xenograft Core facility at the Case Western Reserve University (Cleveland, OH). For tumorigenicity assays, 1 × 10⁶ of HPAC-VEC or HPAC-OSM cells were resuspended in 50 μL of 1:1 mix of Matrigel:media mix. Orthotopic pancreatic injections were performed on 8- to 12-week-old male or female, nude or NSG mice anesthetized using isoflurane. The mouse was laid on its right side and after appropriate sterilization of the surgical site; a small incision was made slightly medial to the splenic silhouette. The pancreas was externalized and 50 μL of cells were slowly injected close to the tail of the pancreas. The pancreas was then internalized and abdominal wall and incision site closed with sterile sutures. Tail-vein injections were performed by slightly warming the tail under IR lamp and injecting 100 μL of cell suspension containing 1 × 10⁶ tumor cells. The in vivo, coinoculation studies (using human fibroblasts and HPAC cells) were performed as follows. HPAC cells were cocultured at a 1:3 ratio with FB-VEC or FB-OSM for 7 days. GFP positivity (from the GFP-expressing HPAC cells) was used to assess the ratio of HPAC:FB in both groups and the ratio was normalized to 4:1 prior to orthotopic injection of 1.2 × 10⁶ cells into the pancreas of nude mice. Limiting dilution assays were performed by injecting the indicated number of tumor cells in 100-μL Matrigel-media mix into the flanks of the mice. For all experiments, tumor growth was monitored by bioluminescence imaging after injecting luciferin 10 minutes prior to imaging. Tumor volume was also measured manually using calipers and tumor weight assessed following euthanasia and tumor retrieval. All animals were used in compliance with the guidelines approved by the Case Western Reserve University Institutional Animal Care and Use Committee.
Viral constructs and virus production
Lentiviruses were packaged and used to infect target cells as described previously (26). PLK0.1 vectors containing shRNAs targeting ZEB1 (TRC Version: TRCN0000017565; Clone Name: NM_030751.2-572s1c1 and TRC Version: TRCN0000017566; Clone Name: NM_030751.2-70s1c1) were purchased from Sigma Aldrich. PLK0.1 vector containing shRNA-targeting GFP has been described previously (26). The SORE6 cancer stem cell reporter construct was a kind gift from Dr. Lalage Wakefield at Center for Cancer Research, NCI, Bethesda, MD. (27). Lentiviral pLenti-CMV-GFP was obtained from Addgene (plasmid #17447). pBABE-puro-hTERT was purchased from Addgene (plasmid #1771). pLenti-Neo-VEC was generated using gateway cloning and recombining the multiple cloning site of PCR8 topo vector (Invitrogen; catalog no. 46-0899) into the lentiviral vector pLenti-CMV-Dest (Addgene; plasmid# 17451). pLenti-Neo-OSM as generated by subcloning OSM cDNA (OriGene; catalog # SC-121421) into gateway entry vector pLenti-ENTR4 (Addgene; plasmid# 17424) and recombined into lentiviral destination vector (Addgene; plasmid# 17451). pFLUG-GFP-LUC (Firefly) fusion construct was a kind gift from Dr. Huiping Liu at Northwestern University, Feinberg School of Medicine, Chicago, IL. (28).
Results
Elevated OSM and OSMR induce EMT in PDAC cells
Utilizing publicly available gene expression datasets, we interrogated the levels of OSM and OSMR in invasive pancreatic adenocarcinomas. PDAC tissue exhibited a significant increase in OSM and OSMR gene expression relative to normal pancreas (Fig. 1A), which correlates with an elevated STAT3 gene expression signature (Fig. 1B). Additional datasets also demonstrated elevated OSM and OSMR expression in PDAC tissue (Supplementary Fig. S1A–S1D; refs. 29–32). Moreover, studies documenting the presence of OSM within primary and metastatic lesions in murine models, and elevated levels of OSM in the serum of PDAC patients who respond poorly to treatment provide further rationale for examining OSM in the biology of PDAC (19, 20). The elevated level of OSM, OSMR, and STAT3 target genes support our further investigation into the biological role of OSM in PDAC. For this, we treated four PDAC cell lines with recombinant human OSM, and observed an emergent mesenchymal morphology consistent with an epithelial–mesenchymal transition (EMT), concomitant with STAT3 activation (Fig. 1C and D). The mesenchymal morphology was accompanied by the repression of epithelial junctional protein, E-cadherin (CDH1; Fig. 1E), and induction of ZEB1 (Fig. 1E), an EMT transcription factor capable of repressing E-cadherin expression. Further analysis of OSM-induced EMT confirmed the time-dependent induction of ZEB1 and Snail (SNAI1; another key EMT transcription factor), which correlated with the upregulation of CD44, a cell surface marker used to enrich for CSCs from various cancer types (Fig. 2A–C). Moreover, exposure to OSM increases expression of the OSM receptor (OSMR), creating a positive feedback loop capable of enhancing the impact of TME OSM (Fig. 2A). Conversely, the repression of E-cadherin correlated with the loss of CD24 expression, indicating that the emergent mesenchymal cells have acquired a CD24LOW/CD44HI phenotype, a well-described CSC phenotype across multiple tumor types, including pancreatic cancer (Fig. 2C; refs. 10, 28, 33).

Elevated OSM and OSMR in PDAC drive EMT. A, Oncomine data of whole tumor tissue versus normal pancreas tissue examining OSM and OSMR mRNA levels in PDAC and normal pancreas (60). B, Expression of a STAT3 gene expression signature (generated by filtering pancreatic cancer vs. normal analysis; then applying filter “genes differentially expressed in melanoma cells in response to STAT3 expression”) in PDAC and normal pancreas (Supplementary Fig. S9). C–E, A panel of PDAC cells lines were treated with recombinant OSM for one week and analyzed for morphologic changes using bright-field microscopy (D; images shown at 200×). STAT3 phosphorylation (Tyr 705), total STAT3, and Actin were assessed using Western blot analysis (D), and E-cadherin (CDH1), and ZEB1 were assessed using qRT-PCR (E).
Elevated OSM and OSMR in PDAC drive EMT. A, Oncomine data of whole tumor tissue versus normal pancreas tissue examining OSM and OSMR mRNA levels in PDAC and normal pancreas (60). B, Expression of a STAT3 gene expression signature (generated by filtering pancreatic cancer vs. normal analysis; then applying filter “genes differentially expressed in melanoma cells in response to STAT3 expression”) in PDAC and normal pancreas (Supplementary Fig. S9). C–E, A panel of PDAC cells lines were treated with recombinant OSM for one week and analyzed for morphologic changes using bright-field microscopy (D; images shown at 200×). STAT3 phosphorylation (Tyr 705), total STAT3, and Actin were assessed using Western blot analysis (D), and E-cadherin (CDH1), and ZEB1 were assessed using qRT-PCR (E).

OSM-induces mesenchymal/CSC plasticity. A–C, HPAC cells were exposed to recombinant OSM for 4, 8, 16 hours (H) and 1, 3, 5, 7, 10, 14 days (D). qRT-PCR analysis was used to quantify expression of the indicated genes. (A). Western blot analysis was used to assess the indicated proteins (B). CD24 and CD44 surface expression was assessed by flow cytometry (C). D, HPAC cells were infected with lentiviral particles encoding a CSC-specific SORE6 GFP-reporter construct (HPAC-SORE6), and left untreated or treated with recombinant OSM for 8 days. Flow cytometry was performed for CD24/CD44 surface expression, as well as GFP intensity (numbers represent the percentage of cells that were GFP positive) (Supplementary Fig. S10). E–G, HPAC cells were sorted using FACS for CD24HI/CD44LOW and CD24LOW/CD44HI populations. qRT-PCR analysis was used to quantify the expression of the indicated genes (E). CD24HI/CD44LOW cells were treated with OSM for 3, 7, and 18 days and CD24 and CD44 expression was assessed by flow cytometry (F). CD24HI/CD44LOW cells were sorted from native HPAC populations and cultured in basal HPAC medium for 7 days (far left); CD24LOW/CD44HI sorted cells were cultured for 3 and 7 days in the presence or absence of OSM (adjacent three panels) and CD24 and CD44 expression was assessed by flow cytometry (G). H, HPAC cells were treated with recombinant OSM for 7 days and subsequently were monitored for growth over a period of 4 days. The graph shows percent confluence of cells at the indicated times. I and J, HPAC cells were treated for 7 days with recombinant OSM or IL6.Western blot analysis (I) and flow cytometry (J) were performed after 3 and 7 days of OSM treatment.
OSM-induces mesenchymal/CSC plasticity. A–C, HPAC cells were exposed to recombinant OSM for 4, 8, 16 hours (H) and 1, 3, 5, 7, 10, 14 days (D). qRT-PCR analysis was used to quantify expression of the indicated genes. (A). Western blot analysis was used to assess the indicated proteins (B). CD24 and CD44 surface expression was assessed by flow cytometry (C). D, HPAC cells were infected with lentiviral particles encoding a CSC-specific SORE6 GFP-reporter construct (HPAC-SORE6), and left untreated or treated with recombinant OSM for 8 days. Flow cytometry was performed for CD24/CD44 surface expression, as well as GFP intensity (numbers represent the percentage of cells that were GFP positive) (Supplementary Fig. S10). E–G, HPAC cells were sorted using FACS for CD24HI/CD44LOW and CD24LOW/CD44HI populations. qRT-PCR analysis was used to quantify the expression of the indicated genes (E). CD24HI/CD44LOW cells were treated with OSM for 3, 7, and 18 days and CD24 and CD44 expression was assessed by flow cytometry (F). CD24HI/CD44LOW cells were sorted from native HPAC populations and cultured in basal HPAC medium for 7 days (far left); CD24LOW/CD44HI sorted cells were cultured for 3 and 7 days in the presence or absence of OSM (adjacent three panels) and CD24 and CD44 expression was assessed by flow cytometry (G). H, HPAC cells were treated with recombinant OSM for 7 days and subsequently were monitored for growth over a period of 4 days. The graph shows percent confluence of cells at the indicated times. I and J, HPAC cells were treated for 7 days with recombinant OSM or IL6.Western blot analysis (I) and flow cytometry (J) were performed after 3 and 7 days of OSM treatment.
In addition, exposure of HPAC cells to recombinant OSM increased activity of a GFP-reporter construct containing OCT4/SOX2 response elements (SORE6), which has been previously described to identify cancer stem cell populations (ref. 27; Fig. 2D). To confirm the connection between a CD24LOW/CD44HI cell surface profile and a mesenchymal phenotype, the small fraction of CD24LOW/CD44HI cells present in parental HPAC population were separated by FACS (Supplementary Fig. S2). Indeed, the CD24LOW/CD44HI population expressed elevated levels of SNAI1 and ZEB1, as well as reduced levels of CDH1 when compared with the CD24HI/CD44LOW population (Fig. 2E). To further confirm that OSM converts cells into a CD24LOW/CD44HI state rather than selecting for a preexisting CD44HI population, sorted CD24HI/CD44LOW cells were exposed to OSM for various times. Again, OSM induced the acquisition of CD44 and the loss of CD24 (Fig. 2F), while untreated CD24HI/CD44LOW cells retained their epithelial, CD24HI/CD44LOW state, indicating the epithelial/non-CSC state is quite stable (Supplementary Fig. S3). Conversely, the CD24LOW/CD44HI-sorted population spontaneously generated differentiated CD24HI cells (Fig. 2G). The ability to produce differentiated progeny is a property of CSCs. Notably, the de novo generation of a differentiated CD24HI population was prevented by adding OSM to the medium following the sort for CD44HI cells, indicating that OSM can suppress the differentiation of the CD44HI population. Finally, OSM generated the emergence of a CD44HI/CD133HI population (Supplementary Fig. S4), which possesses significant tumor-initiating capabilities and metastatic potential within PDAC (11, 34). Importantly, analysis of cell confluency using the Incucyte Zoom imaging system or analysis of cell number determined that OSM does not alter proliferation at the doses used in our experiments (Fig. 2H; Supplementary Fig. S5B), further indicating that OSM is not selecting for preexisting CD24LOW/CD44HI cells. In contrast to OSM, IL6 was unable to convert parental HPAC into CD24LOW/CD44HI, likely due to the weaker induction of STAT3Y705 phosphorylation and ZEB1 expression (Fig. 2I and J). This further implies that OSM may be a more potent driver of aggressive phenotypes in PDAC in certain contexts. While we do not observe comparable phenotypic response to IL6 in our studies, we note that IL6 has also been demonstrated to play a significant role in PDAC initiation and progression in transgenic murine mouse models (22, 35).
OSM induces motility, gemcitabine resistance, and increased tumorigenic potential
Our observation that OSM induces key EMT transcription factors, generates cells with a CD24LOW/CD44HI phenotype, and activates a CSC-reporter prompted us to assess whether OSM exposure enhanced biological characteristics consistent with mesenchymal/CSC. For this, OSM was exogenously expressed in HPAC cells by lentiviral transduction (HPAC-OSM) so as to enrich for a stable CD24LOW/CD44HI population. An empty lentivirus was used as a control (HPAC-VEC). One week postinfection, HPAC-OSM cells exhibited increased STAT3Y705 phosphorylation, increased ZEB1 expression, a loss of E-cadherin expression, and a conversion from CD44LOW to CD44HI (Fig. 3A). As observed with recombinant OSM, exogenous OSM expression did not impact the proliferation of HPAC cells (Supplementary Fig. S5). However, HPAC-OSM cells were significantly more migratory on multiple matrices (including fibronectin and Matrigel, as well as uncoated wells, but not collagen; Fig. 3B; Supplementary Fig. S6A–S6C).

OSM induces properties of CSC and increases cell motility. HPAC cells (expressing GFP-LUC fusion protein) were infected with lentiviruses encoding OSM (HPAC-OSM) or control vector (HPAC-VEC). A, One week postinfection, Western analysis and flow cytometry was performed, as indicated. B, Migration of HPAC-VEC and HPAC-OSM cells was assessed using a live cell IncuCyte Zoom imaging system. Graph shows number of migrated cells (purple colored cells in the adjacent images), error bars represent ± SEM for a representative experiment performed in triplicate. A two tailed paired t test was performed to determine significance; *, P ≤ 0.01. C, HPAC-VEC and HPAC-OSM cells were cultured in the presence or absence of gemcitabine (30 nmol/L) and cell number was monitored using the IncuCyte Zoom live cell imaging system. Graph shows percent confluence of cells at the indicated times, error bars represent ± SEM for a representative experiment performed in triplicate; a two-way ANOVA was performed in order to determine significance; ****, P ≤ 0.001. D, HPAC-VEC and HPAC-OSM populations were injected subcutaneously at limiting dilutions of 100,000, 10,000, and 1,000 cells/injection. Images of resected primary tumors and quantification of primary tumor volume are presented. P values were calculated using a two-tailed Student t test; ***, P ≤ 0.01; ****, P ≤ 0.01.
OSM induces properties of CSC and increases cell motility. HPAC cells (expressing GFP-LUC fusion protein) were infected with lentiviruses encoding OSM (HPAC-OSM) or control vector (HPAC-VEC). A, One week postinfection, Western analysis and flow cytometry was performed, as indicated. B, Migration of HPAC-VEC and HPAC-OSM cells was assessed using a live cell IncuCyte Zoom imaging system. Graph shows number of migrated cells (purple colored cells in the adjacent images), error bars represent ± SEM for a representative experiment performed in triplicate. A two tailed paired t test was performed to determine significance; *, P ≤ 0.01. C, HPAC-VEC and HPAC-OSM cells were cultured in the presence or absence of gemcitabine (30 nmol/L) and cell number was monitored using the IncuCyte Zoom live cell imaging system. Graph shows percent confluence of cells at the indicated times, error bars represent ± SEM for a representative experiment performed in triplicate; a two-way ANOVA was performed in order to determine significance; ****, P ≤ 0.001. D, HPAC-VEC and HPAC-OSM populations were injected subcutaneously at limiting dilutions of 100,000, 10,000, and 1,000 cells/injection. Images of resected primary tumors and quantification of primary tumor volume are presented. P values were calculated using a two-tailed Student t test; ***, P ≤ 0.01; ****, P ≤ 0.01.
Next, we assessed the ability of OSM to induce therapeutic resistance and tumorigenic potential, key characteristics of mesenchymal/CSCs (36–38). HPAC-OSM and HPAC-VEC cells were treated with gemcitabine; a first-line therapy for PDAC, and cell growth was monitored over time. HPAC-OSM cells were significantly less sensitive to gemcitabine (Fig. 3C), when compared with HPAC-VEC cells, suggesting that elevated OSM in the TME may promote gemcitabine resistance. Finally, limiting dilutions of HPAC-VEC and HPAC-OSM cells were subcutaneously injected into the flank of NSG mice (Supplementary Fig. S7). Importantly, HPAC-OSM cells formed significantly larger tumors (∼5–10 times larger) at each of the cell numbers tested, implicating the OSM-induced CD44HI population as highly tumorigenic (Fig. 3D). The existence of the small number of CD44HI cells in the HPAC-VEC population (ranging from ∼2%–12%) is likely contributing to the small tumors generated from this population. Taken together, our data support a role for OSM in generating PDAC cells with mesenchymal/CSC properties that are highly migratory, tumorigenic, and resistant to gemcitabine.
OSM increases tumor burden and metastases in vivo
We next assessed whether the increased motility and tumorigenicity induced by OSM impacted tumor invasiveness and metastatic spread using orthotopic injection of HPAC-VEC and HPAC-OSM. OSM expression conferred a significant increase in primary tumor burden as well as increased intraperitoneal metastatic spread (Fig. 4A), a common feature in patients with PDAC. Furthermore, HPAC-OSM demonstrated a greater capacity to colonize the lung following tail-vein injection, when compared with HPAC-VEC (Fig. 4B). To better represent a tumor microenvironment with high levels of OSM, we cocultured GFP-labeled HPAC cells (HPAC-GFP) with control human fibroblasts (FB-VEC), or fibroblasts expressing OSM (FB-OSM). HPAC cells cocultured with FB-OSM showed a nearly 3-fold increase in the CD24LOW/CD44HI population (Fig. 4C). Moreover, orthotopic coinjection of HPAC and FB-OSM into the pancreas of mice yielded greater tumor burden and metastatic dissemination when compared with HPAC/FB-VEC coinjection (Fig. 4D and E). HPAC/FB-OSM coinjections spread more often to every site except the body wall, resulting in more rapid lethality (Fig. 4E). This suggests that a stroma high in OSM will impart a more invasive and aggressive phenotype within the tumor by eliciting a mesenchymal/CSC program.
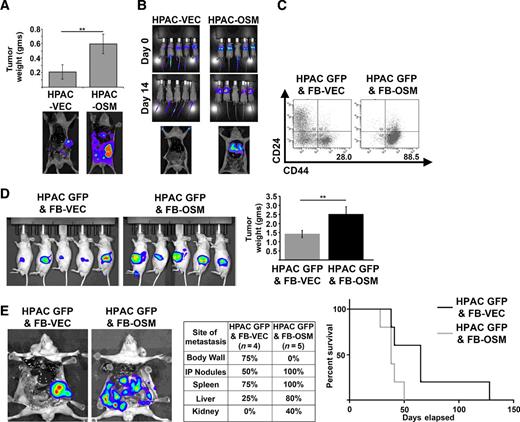
OSM increases tumor burden and metastases in vivo. A, HPAC-VEC and HPAC-OSM cells were injected orthotopically into the pancreas of athymic, nude mice. Tumor weight and representative bioluminescence (BLI) images at the end of the experiment are shown (23 days postinjection). A two-tailed Student t test was used to determine significance; **, P ≤ 0.01. B, HPAC-VEC and HPAC-OSM cells were injected via the tail vein in athymic, nude mice. BLI images showing lung colonization at 14 days postinjection are shown. C–E, HPAC-GFP were cocultured with control fibroblasts (FB-VEC) or fibroblasts expressing OSM (FB-OSM). Following one week of coculture, CD24 and CD44 surface expression on HPAC-GFP was assessed via flow cytometry by gating on the GFP+ cells (C). HPAC-GFP were orthotopically coimplanted with FB-OSM or FB-VEC into nude mice (D). BLI images at 21 days postinjection and quantification of primary tumor weight at the time animals were sacrificed. A two-tailed Student t test was used to determine significance; **, P ≤ 0.01. Representative BLI images, site and frequency of metastasis, and Kaplan–Meier survival curve of mice that received HPAC GFP and FB-VEC or HPAC GFP and FB-OSM cells (E).
OSM increases tumor burden and metastases in vivo. A, HPAC-VEC and HPAC-OSM cells were injected orthotopically into the pancreas of athymic, nude mice. Tumor weight and representative bioluminescence (BLI) images at the end of the experiment are shown (23 days postinjection). A two-tailed Student t test was used to determine significance; **, P ≤ 0.01. B, HPAC-VEC and HPAC-OSM cells were injected via the tail vein in athymic, nude mice. BLI images showing lung colonization at 14 days postinjection are shown. C–E, HPAC-GFP were cocultured with control fibroblasts (FB-VEC) or fibroblasts expressing OSM (FB-OSM). Following one week of coculture, CD24 and CD44 surface expression on HPAC-GFP was assessed via flow cytometry by gating on the GFP+ cells (C). HPAC-GFP were orthotopically coimplanted with FB-OSM or FB-VEC into nude mice (D). BLI images at 21 days postinjection and quantification of primary tumor weight at the time animals were sacrificed. A two-tailed Student t test was used to determine significance; **, P ≤ 0.01. Representative BLI images, site and frequency of metastasis, and Kaplan–Meier survival curve of mice that received HPAC GFP and FB-VEC or HPAC GFP and FB-OSM cells (E).
OSM-induced mesenchymal/CSC plasticity requires JAK/STAT3 signaling
OSM induces activation of the heterodimeric receptor gp130/OSMR, which activates JAK1/2–mediated STAT3 phosphorylation, dimerization, and subsequent STAT3-mediated transcription (of ZEB1, SNAI1, OSMR, as shown in Fig. 2A). To assess whether the suppression of JAK/STAT3 activation prevents OSM-induced mesenchymal/CSC plasticity, HPAC cells were treated with recombinant OSM in the presence or absence of a JAK1/2 inhibitor, ruxolitinib. Indeed, ruxolitinib inhibited STAT3Y705 phosphorylation and suppressed ZEB1 and OSMR expression induced by a 4-hour treatment with OSM (Fig. 5A). Furthermore, upon longer term treatment, ruxolitinib prevented CD44 acquisition, transcription of OSMR and key EMT transcription factors ZEB1 and Snail, and E-Cadherin (CDH1) repression (Fig. 5B–D). Finally, ruxolitinib inhibited OSM-induced cell motility (Fig. 5E). Taken together, the invasive and stem-like properties induced by OSM require JAK-activated STAT3, thus opening up avenues of therapy targeting the intracellular signaling required for OSM-induced mesenchymal/CSC plasticity in PDAC.

OSM-induced mesenchymal/CSC plasticity requires activated STAT3. A, HPAC cells were treated with recombinant OSM, ruxolitinib (RUX), or a combination of both for four hours. Western blot (top) and qRT-PCR (bottom) were performed as indicated. B–D, HPAC cells were treated with recombinant OSM, ruxolitinib, or a combination of both for 8 days. Flow cytometry (B), qRT-PCR (C), and Western blot analysis (D) were performed as indicated. The percentage of CD24LOW/CD44HI cells is indicated by the number below the flow cytometry scan in B. E, Migration of HPAC cells treated as indicated was assessed using a live cell IncuCyte Zoom imaging system. The graph (left) and pictures (right) show the number of migrated cells at the indicated times; error bars represent ± SEM for a representative experiment performed in triplicate; a two-way ANOVA was performed to determine significance; ****, P ≤ 0.001.
OSM-induced mesenchymal/CSC plasticity requires activated STAT3. A, HPAC cells were treated with recombinant OSM, ruxolitinib (RUX), or a combination of both for four hours. Western blot (top) and qRT-PCR (bottom) were performed as indicated. B–D, HPAC cells were treated with recombinant OSM, ruxolitinib, or a combination of both for 8 days. Flow cytometry (B), qRT-PCR (C), and Western blot analysis (D) were performed as indicated. The percentage of CD24LOW/CD44HI cells is indicated by the number below the flow cytometry scan in B. E, Migration of HPAC cells treated as indicated was assessed using a live cell IncuCyte Zoom imaging system. The graph (left) and pictures (right) show the number of migrated cells at the indicated times; error bars represent ± SEM for a representative experiment performed in triplicate; a two-way ANOVA was performed to determine significance; ****, P ≤ 0.001.
STAT3-activated ZEB1 drives OSM-induced mesenchymal/CSC plasticity
As ZEB1 has been shown to be a master regulator of EMT, and a direct target of OSM-activated STAT3, we hypothesized that ZEB1 was a key component of OSM-induced mesenchymal/CSC plasticity. To test this hypothesis, HPAC-OSM, which have a 95.9% CD24LOW/CD44HI profile, were infected with lentiviruses encoding short hairpin RNAs targeting ZEB1 (or shGFP as a control), and knockdown of ZEB1 was confirmed by Western blot analysis (Fig. 6A). Importantly, knockdown of ZEB1 did not alter STAT3Y705 phosphorylation (Fig. 6A) or downstream transcriptional target OSMR (Fig. 6B). ZEB1 knockdown increased E-cadherin expression (CDH1; Fig. 6B), though to a lesser extent in the population with less ZEB1 knockdown (shZEB1-566). The increase in CDH1 correlated with a more epithelial morphology compared with shGFP control (Fig. 6C). Most importantly, the suppression of ZEB1 in HPAC-OSM cells led to a marked reduction in the number CD44HI cells at both 1 and 3 weeks following infection with the ZEB1 shRNAs (from ∼96% in shGFP controls to 42.2% for shZEB1-565 and 36.4% for shZEB1-566). These data support our hypothesis that ZEB1 is a crucial JAK/STAT3–activated gene required for OSM-induced mesenchymal/CSC plasticity in PDAC cells.

ZEB1 is crucial to OSM-induced mesenchymal/CSC plasticity. CD24LOW/CD44HI HPAC-OSM cells were infected with lentiviruses encoding two short hairpin RNAs targeting ZEB1 (shZEB1-765 and shZEB1-766) or a control (shGFP). Following selection, Western blot analysis (A), qRT-PCR (B), bright-field microscopy (C), and flow cytometry (D) were performed as indicated.
ZEB1 is crucial to OSM-induced mesenchymal/CSC plasticity. CD24LOW/CD44HI HPAC-OSM cells were infected with lentiviruses encoding two short hairpin RNAs targeting ZEB1 (shZEB1-765 and shZEB1-766) or a control (shGFP). Following selection, Western blot analysis (A), qRT-PCR (B), bright-field microscopy (C), and flow cytometry (D) were performed as indicated.
Discussion
Patients diagnosed with pancreatic cancer currently have dismal survival rates, with 75% of patients succumbing to their disease within one year of diagnosis. The observation that transformed pancreatic epithelial cells can disseminate to distant organs even before a frank malignancy is detectable at the primary site underscores the difficulty in managing patients with aggressive PDAC (2). Our understanding of how OSM, (39) present in the PDAC TME, impacts mesenchymal/CSC plasticity and gives rise to metastatic and therapy-resistant PDAC growth is currently limited and would provide important insights into how PDAC may be targeted.
The CSC hypothesis places cells with self-renewal capacity and the ability to differentiate at the top of the tumor cell hierarchy. Importantly, CSCs harboring a mesenchymal phenotype display a decreased sensitivity to chemo- and radiotherapy, resulting in an enrichment of CSCs following treatment. Evidence is emerging that suggests that non-CSCs can be induced into a transient CSC-like, drug-tolerant state when exposed to chemotherapies. Our studies support such a model, whereby OSM exposure induces the conversion of epithelial/non-CSC into mesenchymal/CSCs (Fig. 7). Mechanistically, we demonstrate that gp130/OSMR activation results in JAK/STAT3–mediated ZEB1 transcription, and ZEB1-dependent expression of CSC marker CD44. Consequently, a TME high in OSM creates more aggressive PDAC cells with greater tumorigenicity, increased invasive and metastatic potential, and resistance to gemcitabine, classified here as a CD24LOW/CD44HI population. However, early PDAC stem cells were identified as CD24HI/CD44HI, yet we did not observe a CD24HI/CD44HI population following OSM exposure (10). Rather, CD24HI cells typically reduced CD24 expression first, and then gained expression of CD44. This finding underscores the heterogeneity of CSC populations and the difficulties in identifying/targeting cellular plasticity, and points to the importance of using functional assays when defining PDAC stem biology. Moreover, OSMR is induced by OSM ligand, suggesting that a positive feedback loop is engaged to promote greater OSMR/JAK/STAT3 activation and maintain the induced mesenchymal/CSC cell state. This OSM/OSMR–positive feedback loop provides a number of potential therapeutic targets, which, if disrupted, may prevent the emergence of aggressive mesenchymal/CSCs in response OSM. In line with our observations, a recent study also demonstrated that OSM induces EMT in CFPAC1 pancreatic cancer cells, in addition to lung cancer cell lines. OSM induced mesenchymal properties and differential 3D growth and colony architecture that was regulated through a JAK-dependent mechanism. Our studies build upon these observations by demonstrating that the mesenchymal/CSC phenotype induced by OSM also promotes widespread metastasis and gemcitabine resistance (40).

Schematic of OSM-induced mesenchymal/CSC plasticity. Elevated OSM within the pancreatic tumor microenvironment induces STAT3 activation (Y705 phosphorylation), leading to transcriptional activation of ZEB1. As ZEB1 accumulates, E-cadherin and CD24 surface expression are repressed, while Snail and CD44 surface expression are increased. The resulting EMT and acquisition of CSC properties decrease gemcitabine sensitivity, and increase tumor-initiating capacity and metastasis. A–C, Points where the aggressive phenotypes engaged by OSM can be inhibited (including OSM-neutralizing or OSMR-blocking antibodies, chemical inhibition of activated OSMR/JAK, or ZEB1 silencing).
Schematic of OSM-induced mesenchymal/CSC plasticity. Elevated OSM within the pancreatic tumor microenvironment induces STAT3 activation (Y705 phosphorylation), leading to transcriptional activation of ZEB1. As ZEB1 accumulates, E-cadherin and CD24 surface expression are repressed, while Snail and CD44 surface expression are increased. The resulting EMT and acquisition of CSC properties decrease gemcitabine sensitivity, and increase tumor-initiating capacity and metastasis. A–C, Points where the aggressive phenotypes engaged by OSM can be inhibited (including OSM-neutralizing or OSMR-blocking antibodies, chemical inhibition of activated OSMR/JAK, or ZEB1 silencing).
Elevated levels of OSM in the tumor microenvironment (TME) have been associated with highly aggressive metastatic cancers, increased risk of tumor recurrence, and a poor prognosis in a variety of cancers (24, 41–44). OSM in the TME may originate from a host of immune cells as well as cancer-associated fibroblasts or adipose tissue (45–47). There is mounting evidence that the OSM in the TME contributes to tumor progression in many ways. First, macrophages secreting OSM are localized at the advancing, infiltrative margins of carcinomas, which may implicate OSM in tumor invasion (48). Second, highly aggressive basal-like and triple negative breast cancer subtypes express higher levels of OSMR which is associated with adverse clinical outcomes and increased expression of the CSC marker CD44 (47). Finally, DNA-damaging chemotherapy induces additional OSM secretion from peritoneal and bone marrow–derived macrophages, potentially exacerbating the aggressive properties associated with mesenchymal and CSC properties following treatment with genotoxic therapies (49, 50).
Elevated serum levels of OSM are found in patients with PDAC, in line with the significant increase in OSM mRNA (19, 51). In PDAC patients, sustained OSM serum levels following gemcitabine was considered a poor prognostic marker, consistent with our observation that OSM rendered PDAC cells highly resistant to first-line gemcitabine treatment. We attribute the ability of OSM to induce gemcitabine resistance with its ability to reprogram epithelial/non-CSCs into mesenchymal/CSCs. This observation is also in line with recent studies by Zheng and colleagues and Fischer and colleagues, showing that the acquisition of mesenchymal properties led to therapeutic resistance in pancreatic and breast cancer cells (38, 52).
While the IL6 family of cytokines can exhibit redundancy in their biological responses due to the shared use of the gp130 transmembrane receptor, in our studies, OSM has unique biological functions not recapitulated by IL6 (53). Gp130/OSMR heterodimers have characteristics unique from other IL6 family coreceptors that may account for the distinct signaling and biological effects of OSM relative to other IL6 family members, such as enhanced JAK/STAT3 and MAPK activation. When coupled with the observation that OSM and OSMR are significantly elevated in PDAC, and OSMR is induced by OSM, the unique signaling emanating from the OSMR justifies a more thorough analysis of OSM and the signaling cascades described here.
Downstream of OSM/OSMR, JAK/STAT3 activation is increasingly gaining popularity in the field of cancer therapeutics, with ongoing clinical trials using the JAK inhibitor ruxolitinib, including patients with advanced metastatic pancreatic cancer. Ruxolitinib, given as the second-line treatment along with capecitabine, improved overall survival in patients with systemic inflammation and those resistant to first-line therapies (54). STAT3-inhibiting drugs given in combination with additional targeted therapies are proving beneficial in oncogene-addicted cancer cells (such as those expressing the active KRAS mutant) that acquire resistance to MEK inhibitors, gemcitabine, and erlotinib by engaging a feedback activation of STAT3 (27). Furthermore, the recent development of a STAT3 inhibitor BBI-608 (55) as a CSC-selective agent highlights the importance of STAT3 to the CSC phenotype. We propose that suppressing OSM function (by neutralizing OSM in the TME or inhibiting OSMR activity) will prevent cancer cells from engaging a favored escape mechanism, which is to acquire and maintain mesenchymal/CSC properties (Fig. 7A and B). Directly targeting OSM and OSMR has significant advantages, as both OSM and OSMR protein are expressed at lower levels in normal human tissues when compared with other components of the OSM/OSMR/JAK/STAT3 axis (Supplementary Fig. S8). Elevated OSM expression occurs only in inflammatory, pathologic conditions (such as cancer, arthritis, and inflammatory heart disease), which vastly improves the therapeutic window to target OSM/OSMR. Neutralizing or blocking antibodies, and decoy receptors that prevent OSM from engaging OSMR can ameliorate arthritis or prevent inflammatory heart failure in mouse models (56). Of note, blocking antibodies targeting the extracellular domain of OSMR reduced the OSM-mediated dedifferentiation of cardiomyocytes responsible for heart failure (57). We propose that OSMR-targeting antibodies could be conjugated with cytotoxic agents, resulting in more selective targeting of tumor cells, similar to current approaches linking HER2-targeting antibodies with DM1 (58).
Finally, we found that suppression of OSMR/JAK/STAT3–mediated ZEB1 expression markedly reverted the mesenchymal/CSC phenotype, implicating ZEB1 as a crucial driver of OSM-induced CSC properties. In addition to defining ZEB1 as a key downstream effector of OSMR/JAK/STAT3 activation, these findings demonstrated the reversible nature of OSM-induced mesenchymal/CSC plasticity. ZEB1 links EMT and CSC features in pancreatic cancer cells, by inhibiting the expression of the miRNA-200 family, which represses stem cell factors and induces epithelial differentiation. Moreover, ZEB1 and CD44s were shown to participate in a self-sustaining loop to maintain CSC features in pancreatic cancer (59). The net result of OSMR/JAK/STAT3/ZEB1 pathway activation is a reversibly induced mesenchymal/CSC population encompassing aggressive cancer cell properties. By gaining a better understanding of TME cytokines, such as OSM, that induce mesenchymal/CSC plasticity, one may envision tailoring therapies directed at the source of the cytokine or the associated signaling so as to enhance efficacy of current therapies and ultimately improve patient survival.
Disclosure of Potential Conflicts of Interest
No potential conflicts of interest were disclosed.
Authors' Contributions
Conception and design: J.M. Smigiel, N. Parameswaran, M.W. Jackson
Development of methodology: J.M. Smigiel, N. Parameswaran
Acquisition of data (provided animals, acquired and managed patients, provided facilities, etc.): J.M. Smigiel, N. Parameswaran
Analysis and interpretation of data (e.g., statistical analysis, biostatistics, computational analysis): J.M. Smigiel, N. Parameswaran, M.W. Jackson
Writing, review, and/or revision of the manuscript: J.M. Smigiel, N. Parameswaran, M.W. Jackson
Acknowledgments
The authors gratefully acknowledge the research support provided by the Case Comprehensive Cancer Center (Flow cytometry, Imaging and Microscopy core, Athymic Animal and Xenograft core and Small-Animal Imaging Research Center).
Grant Support
This work was supported by grant from the Case Comprehensive Cancer Center (P30 CA43703). M.W. Jackson is supported by the NIH (R01CA138421) and the American Cancer Society (Research Scholar Award # RSG CCG-122517).
The costs of publication of this article were defrayed in part by the payment of page charges. This article must therefore be hereby marked advertisement in accordance with 18 U.S.C. Section 1734 solely to indicate this fact.