


Abstract
Metabolic reprogramming and cancer stem cells drive the aggressiveness of pancreatic ductal adenocarcinoma (PDAC). However, the metabolic and stemness programs of pancreatic precursor lesions (PPL), considered early PDAC development events, have not been thoroughly explored.
Meta-analyses using gene expression profile data from NCBI Gene Expression Omnibus and IHC on tissue microarrays (TMA) were performed. The following animal and cellular models were used: cerulean-induced KrasG12D; Pdx1 Cre (KC) acinar-to-ductal metaplasia (ADM) mice, KrasG12D; Smad4Loss; Pdx-1 Cre (KCSmad4−) intraductal papillary mucinous neoplasm (IPMN) mice, LGKC1 cell line derived from the doxycycline-inducible Gnas IPMN model, and human IPMN organoids. Flow cytometry, Seahorse extracellular flux analyzer, qRT-PCR, and sphere assay were used to analyze metabolic and stemness features. SR18292 was used to inhibit PGC1α, and short hairpin RNA was used to knockdown (KD) PGC1α.
The meta-analysis revealed a significant upregulation of specific stemness genes in ADM-mediated pancreatic intraepithelial neoplasms (PanIN) and IPMN. Meta- and TMA analyses followed by in vitro and in vivo validation revealed that ADM/PanIN exhibit increased PGC1α and oxidative phosphorylation (OXPhos) but reduced CPT1A. IPMN showed elevated PGC1α, fatty acid β-oxidation (FAO) gene expression, and FAO-OXPhos. PGC1α was co-overexpressed with its coactivator NRF1 in ADM/PanINs and with PPARγ in IPMN. PGC1α KD or SR18292 inhibited the specific metabolic and stemness features of PPLs and repressed IPMN organoid growth.
ADM/PanINs and IPMNs show specific stemness signatures with unique metabolisms. Inhibition of PGC1α using SR18292 diminishes the specific stemness by targeting FAO-independent and FAO-dependent OXPhos of ADM/PanINs and IPMNs, respectively.
Pancreatic ductal adenocarcinoma (PDAC), recognized as a lethal disease, is developed mainly from two pancreatic precursor lesions (PPL): acinar-to-ductal metaplasia (ADM)-mediated pancreatic intraepithelial neoplasms (PanIN) and intraductal papillary mucinous neoplasm (IPMN). Cancer stem cells (CSC) drive PDAC tumors' aggressiveness, and unique metabolic programs regulate CSCs. However, regulation of the stemness and metabolic programs in PPLs is unknown. Our meta-analysis, in vitro results, and in vivo data demonstrate that the ADM/PanINs and IPMNs display fatty acid β-oxidation (FAO)-independent and FAO-dependent oxidative phosphorylation, respectively, and show specific stemness signatures. We identified the PGC1α as a significant regulator of unique metabolism and stemness of ADM/PanINs and IPMN. The knockdown of PGC1α or its inhibition using SR18292 repressed the specific metabolism and stemness in PPLs. Thus, this study paves the way for developing a novel PDAC therapy based on targeting metabolism and stemness using PGC1α inhibitor, SR18292.
Introduction
Acinar-to-ductal metaplasia (ADM)-mediated pancreatic intraepithelial neoplasia (PanIN; ADM-PanIN) and intraductal papillary mucinous neoplasm (IPMN) are the two significant pancreatic precursor lesions (PPL) associated with pancreatic ductal adenocarcinoma (PDAC) prognoses (1). Distinct cell types in the pancreas respond differently to oncogenic insults. Recent evidence suggests that mutant Kras in pancreatic acinar cells induces ADM, a pre-precursor lesion that eventually develops into PanINs and PDAC (1). GnasR201C mutation or the loss of Smad4 in the presence of KrasG12D activation results in IPMN (2, 3). Recent genetic and histologic analyses have shown evidence of the IPMN origin of PDAC (4). We have demonstrated previously that cigarette smoke–induced stemness is an early event in the oncogenic transformation of the pancreas (5). Though most of the studies refer to stemness as a cancer-initiating event (6–9), accurate stemness alterations and their regulation during PPL formation are unknown.
Altered metabolism in PDAC is the major factor impeding the treatment of PDAC (10). This metabolic reprogramming supports increased anabolism, leading to the elevated supply of building blocks necessary for the growth and survival of cancer cells. We and others have previously shown that a specific metabolic program regulates cancer stem cells (CSC) in tumors (11, 12). However, the metabolic alterations that occur during PDAC initiation events and whether a specific metabolic program regulates stemness in PPLs are unknown.
In this study, data from both clinical samples and in vivo PPL models suggest that specific stemness and energy metabolic programs are elevated during the formation of ADM/PanINs and IPMNs. In particular, both lesions upregulate PGC1α, a central regulator of energy metabolism. Inhibition or knockdown (KD) of PGC1α repressed stemness by targeting fatty acid-β oxidation (FAO)-independent and FAO-dependent oxidative phosphorylation (OXPhos) of ADM/PanINs and IPMNs, respectively, highlighting the role of PGC1α in PDAC initiation events.
Materials and Methods
Cell culture and treatments
Primary mouse cell lines, KC6141 and T161, were generated from the pancreas of genetically engineered mice KrasG12D; Pdx-1 Cre (KC) and KrasG12D; Smad4Loss; Pdx-1 Cre (KCSmad4−) mice, respectively. The LGKC1 primary cell line was derived from the doxycycline-inducible Gnas IPMN mouse model (p48-Cre; LSL-KrasG12D; Rosa26R-LSL-rtTA-TetO-GnasR201C mice or Kras; Gnas mice or KG mice). We received the LGKC1 primary cell lines as a kind gift from Anirban Maitra (MD Anderson Cancer Center; Houston, TX). KC, KCSmad4−, and LGKC1 cell lines were cultured in RPMI1640 (Invitrogen, catalog no. 11875) supplemented with 10% FBS and 1% penicillin/streptomycin. Gnas was induced in LGKC1 cells by treatment with 10 ng to 100 ng doxycycline. All cell lines were authenticated and verified as Mycoplasma-free every month. In some experiments, cells were treated with vehicle control (DMSO) or SR18292 (Sigma, catalog no. SML2146), a selective inhibitor of PGC1α, at 40 μmol/L for 48 hours. Human IPMN organoids were a kind gift from Mokenge Malafa, H. Lee Moffitt Cancer Center and Research Institute, Tampa, FL, and were cultured as we did previously (13). Organoid growth after SR18292 treatment was monitored in the Incucyte Live-Cell Imaging analysis system (Essen BioScience).
Mouse treatment studies
Animal experiments were carried out according to the University of Nebraska Medical Center (UNMC) Institutional Animal Care and Use Committee regulations. Mice were treated with cerulean (Sigma, catalog no. C9026) or PBS to induce acute pancreatitis as performed previously (14). Briefly, 8 hourly intraperitoneal cerulean injections (75 μg/kg body weight) were given on 2 alternate days. The mice were sacrificed 2, 7, and 21 days after the last day of injection, and tissues were collected for analysis.
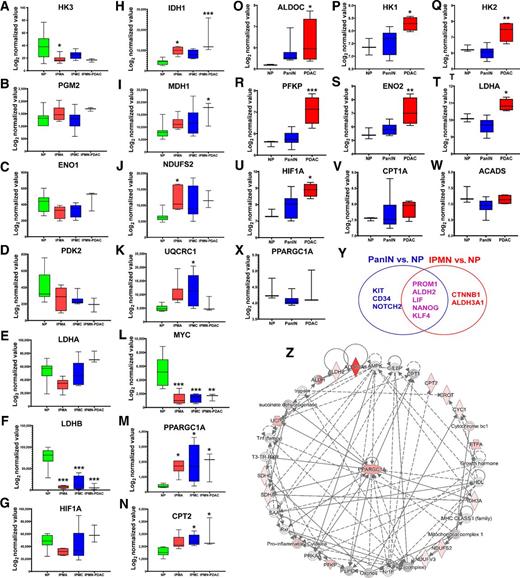
Meta-analysis of stemness programs and metabolic states in IPMN- and PanIN-mediated PDAC progression. NCBI GEO datasets (GSE19650 and GSE43288) were used to investigate the differential transcriptomic signatures of stemness and metabolic genes. The data analysis and processing were performed by quantile normalization and log2 transformation. A–N, Representation of the differentially expressed glycolysis genes (A–G), OXPhos genes (H–K), MYC (L), PPARGC1A (M), and CPT2 (N) in indicated samples: NP (N = 7), IPMN-derived PDAC (IPMN-PDAC; n = 3), IPMA or IPMN with low-grade dysplasia (n = 6), and IPMC or IPMN with high-grade dysplasia (n = 6). O–X, Representation of the differentially expressed glycolysis genes (O–U), fatty acid β-oxidation genes (V–W), and PPARGC1A (X) in indicated samples: NP (n = 3), PanIN (n = 13), and PDAC (n = 4). Data represent mean ± SD. P values were calculated using ordinary one-way ANOVA (multiple comparisons). The mean of each sample was compared with the mean of NP. Asterisks indicate a statistically significant difference between each sample and NP (P < 0.05; ∗, P < 0.05; ∗∗, P < 0.01; ∗∗∗P < 0.001.) Y, Venn diagram showing common and unique overexpressed stemness genes in PanIN and IPMN. Data represent mean ± SD. P values were calculated using ordinary one-way ANOVA (multiple comparisons; ∗, P < 0.05). Z, Network analysis of the differentially expressed stemness and metabolic genes from the GSE19650 dataset using IPA. The network shows that the PPARGC1A is central to stemness, FAO, and OXPhos pathways in IPMN.
Meta-analysis of stemness programs and metabolic states in IPMN- and PanIN-mediated PDAC progression. NCBI GEO datasets (GSE19650 and GSE43288) were used to investigate the differential transcriptomic signatures of stemness and metabolic genes. The data analysis and processing were performed by quantile normalization and log2 transformation. A–N, Representation of the differentially expressed glycolysis genes (A–G), OXPhos genes (H–K), MYC (L), PPARGC1A (M), and CPT2 (N) in indicated samples: NP (N = 7), IPMN-derived PDAC (IPMN-PDAC; n = 3), IPMA or IPMN with low-grade dysplasia (n = 6), and IPMC or IPMN with high-grade dysplasia (n = 6). O–X, Representation of the differentially expressed glycolysis genes (O–U), fatty acid β-oxidation genes (V–W), and PPARGC1A (X) in indicated samples: NP (n = 3), PanIN (n = 13), and PDAC (n = 4). Data represent mean ± SD. P values were calculated using ordinary one-way ANOVA (multiple comparisons). The mean of each sample was compared with the mean of NP. Asterisks indicate a statistically significant difference between each sample and NP (P < 0.05; ∗, P < 0.05; ∗∗, P < 0.01; ∗∗∗P < 0.001.) Y, Venn diagram showing common and unique overexpressed stemness genes in PanIN and IPMN. Data represent mean ± SD. P values were calculated using ordinary one-way ANOVA (multiple comparisons; ∗, P < 0.05). Z, Network analysis of the differentially expressed stemness and metabolic genes from the GSE19650 dataset using IPA. The network shows that the PPARGC1A is central to stemness, FAO, and OXPhos pathways in IPMN.
Isolation of mouse primary pancreatic cells and three-dimensional culture
The pancreas was removed and washed with ice-cold Hank's Balanced Salt Solution (HBSS) media. The organ was minced into 1–5 mm pieces followed by digestion with collagenase P [HBSS media containing 10 mmol/L HEPES, 0.5 mg/mL of collagenase P (Millipore Sigma, catalog no. COLLP-RO Roche), 10 μg/mL of DNase I, and 0.2 mg/mL of trypsin inhibitor (Thermo Fisher Scientific, catalog no. 17075029)]. An equal volume of cold HBSS media containing 10% FBS was added after digestion to stop the digestion. The digested pancreatic pieces were washed twice with HBSS media containing 10% FBS and pipetted through a 100-μm cell strainer (Corning, catalog no. CLS431752). To make single cells, cells were incubated at 37°C for 5 minutes in trypsin. Cold HBSS media containing 10% FBS was added to stop the trypsin activity. Cells were washed and resuspended in HBSS media (containing 10 mmol/L HEPES, 5% FBS, 10 μg/mL of DNase I, and 0.1 mg/mL trypsin inhibitor). For three-dimensional (3D) culture, pancreatic cells were resuspended in a 1:3 media: Matrigel (growth-factor reduced, Corning, catalog no. 354230). A 200 μL of suspension was seeded onto a 48-well plate and incubated for 30 minutes at 37°C to allow solidification. After solidification, we added 500 μL of RPMI medium supplemented with 10% FBS, 1% penicillin/streptomycin, 0.1 mg/mL soybean trypsin inhibitor, and indicated inhibitor. The number of duct-like structures were counted per field (whole well) after 5 days, and the images were captured using the EVOS FL Auto Imaging System (Thermo Fisher Scientific).
Generation of PGC1α stable KD cells
The Colo357 pancreatic cancer cells with stable PGC1α KD and scrambled (SCR) control cells were generated using a PGC1α human shRNA plasmid kit (Origene, TG310260). LGKC1 cells with stable KD of PGC1α were generated using a mouse PGC1α shRNA plasmid (Santa Cruz Biotechnology, catalog no. Sc-38885-SH) and control shRNA plasmid B (Sc-108065). Cells were transfected with SCR and short hairpin (shRNA) plasmids using TurboFectin 8.0 transfection reagent (Origene, TF81001). A total of 72 hours after transfection, GFP+-transfected Colo357 cells were sorted using FACS. Stably transfected cells were selected by treating with puromycin (2 μg/mL). The efficiency of PGC1α KD was examined using Western blot analysis and RT-PCR assays.
In vivo tumorigenicity assay
Cells (15 million) were suspended in 500 μL PBS and mixed with Matrigel (Thermo Fisher Scientific; 1:1 ratio). Cells (1.5 million) in 100 μL were injected subcutaneously into the right and left flanks of 8-week-old athymic nude mice. Four to 6 mice were used per group, and the appearance of tumors was checked by palpation. Animals injected with LGKC1 cells were maintained with doxycycline in sucrose water. Animals were sacrificed soon after the tumor nodule reached a 1 to 1.5 cm diameter (after 3 weeks). Tumor size was assessed by external measurement of the tumors' length and width using a caliper as soon as tumors reached measurable size. The tumor volume was calculated using the formula: volume (mm3) = 1/2 length (mm) × [width (mm)]2.
Sphere culture
For sphere culture, cells were cultured in low-attachment culture plates in stem cell medium: DMEM/F12 (Invitrogen) supplemented with 1% B27, EGF (20 ng/mL), and basic FGF (10 ng/mL). In some experiments, cells (2,000/well or 500/well) were plated in 96-well low-attachment culture plates in 200 μL of the stem cell medium. The number of spheres for each well was monitored for 4 to 10 days. Images were captured using the EVOS FL Auto Imaging System (Thermo Fisher Scientific) or Incucyte Live-Cell Imaging analysis system (Essen BioScience). The number of spheres (>50 μm) was counted per field (whole well). In some experiments, sorted acino-ductal (AD) cells were seeded under sphere culture conditions and maintained in vehicle control (DMSO) or SR18292 (40 μmol/L) for 7 days before analysis.
Immunoprecipitation and immunoblotting
Protein lysates (500 μg) were immunoprecipitated with 2 μL of rabbit anti-PGC1α (Invitrogen, catalog no. PA5-72948) antibody. First, 20 μL of dynabeads (Invitrogen, catalog no. 10004D) were incubated with rabbit anti-PGC1α antibody for 1 hour at room temperature. Afterward, protein lysates were incubated with the antibody-bound dynabeads overnight at 4°C. The next day, the immune complex on beads was washed three times with PBS, and the sample was eluted in 2× SDS-PAGE gel-loading buffer by heating the sample in a 95°C water bath for 5 minutes. The immunoprecipitated products were subjected to 10% SDS-PAGE, then transferred onto a polyvinylidene difluoride (PVDF) membrane and immunoblotted with mouse anti-PGC1α antibody 1:1,000 (Santa Cruz Biotechnology, catalog no. 518025) and mouse anti-acetylated lysine antibody 1:1,000 (Invitrogen, MA1-2021).
Western blotting analysis
Cells were lysed in RIPA buffer (50 mmol/L Tris-HCl, 150 mmol/L NaCl, 1% NP-40, 0.5% sodium deoxycholate, 0.1% SDS) containing protease inhibitors (1 mmol/L phenyl-methyl sulphonyl fluoride, 1 μg/mL aprotinin, 1 μg/mL leupeptin). Cell lysates were spun at 13,000 rpm for 30 minutes to remove debris, and protein quantification was performed using the Bio-Rad DC Protein Assay kit (RRID:SCR_008426). Total protein (40 μg/well) was fractionated by 10% SDS-PAGE. Fractionated proteins were transferred to PVDF membranes. Membranes were blocked in 5% non-fat dry milk in PBS containing 0.1% Tween 20 (PBST). Blots were incubated overnight at 4°C with primary antibodies: ALDH1A1, 1:1,000 (Santa Cruz Biotechnology, catalog no. Sc 374149); mouse anti-PGC1α, 1:1,000 (Santa Cruz Biotechnology, catalog no. 518025); and Smad4, 1:1,000 (RRID:AB_627905). β-Actin was used as a loading control for protein normalization. The membranes were then washed in PBST, probed with the appropriate secondary antibodies, incubated for an hour at room temperature, and then washed with PBST. Signals were detected with the enhanced chemiluminescence kit (Thermo Fisher Scientific).
Flow cytometry
Aldehyde dehydrogenase (ALDH) activity was measured using an AldeRed ALDH detection assay kit (EMD Millipore SCR150) following the manufacturer's instructions. Stained cells were analyzed using LSR II Green (BD Biosciences) with the green fluorescence channel (515–545 nm), and data were analyzed using the FACS DIVA software program (BD Biosciences). For sorting, single mouse primary acinar cells were incubated for 30 minutes with 100 μg/mL FITC-conjugated UEA-1 (Vector laboratories, catalog no. FL-1061-5) at room temperature in serum-free DMEM media (containing 0.1 mg/mL trypsin inhibitor and 10 μg/mL of DNase I). After washing, UEA1 FITC-labeled single acinar cells were stained with PE-Cy7 anti-mouse CD133 antibody (BioLegend, 141209) in HBSS media (containing 10 mmol/L HEPES, 5% FBS, 10 μg/mL of DNase I, and 0.1 mg/mL trypsin inhibitor) for 20 minutes at 4°C. After washing, cells were stained with 4′,6-diamidino-2-phenylindole (DAPI) and analyzed/sorted using FACS Aria (BD Biosciences). In some experiments, acinar cells were stained with UEA1-FITC, AldeRed (Millipore, catalog no. SCR150) or Super Bright 600 Anti-mouse cKit antibody (eBioscience, catalog no. 63-1171-80), and PE-Cy7 anti-mouse CD133 antibody (BioLegend, 141209).
IHC
Tissue microarrays (TMA), chronic pancreatitis (CP; US Biomax, catalog no. BIC14011b), and IPMN (CHTN_PanCA1) were purchased and subjected to IHC staining by using the following primary antibodies at the indicated dilution: PGC1α 1:100 (Santa Cruz Biotechnology, catalog no. 518025) and CPT1A 1:100 (Proteintech, catalog no. 15184-I-AP). Antigen retrieval was performed in 10 mmol/L sodium citrate buffer (pH 6.0). The stained sections were scored by Subodh M. Lele (pathologist, UNMC). The intensity of protein expression was graded on a scale of 0 to 3 (0, no staining; 1+, weakly positive; 2+, moderately positive; 3+, strongly positive). The percentage of positive staining was scored in a range of (0%–100% or 0–1). A histoscore was calculated by multiplying intensity (0–3) and positivity (0–1), ranging between 0 and 3. GraphPad Prism software (RRID:SCR_002798) was used to calculate P values and to design graphs.emph
Immunofluorescence staining
Harvested tissues were fixed in 10% formalin and embedded in paraffin. Immunofluorescence analysis of tissue sections was performed as shown previously (11). Briefly, slides were baked for 2 hours at 60°C, deparaffinized in xylene, and rehydrated sequentially in ethanol. For antigen retrieval, slides were microwaved in sodium citrate buffer for 15 minutes. Slides were blocked in 5% normal goat serum and incubated with primary antibody overnight at 4°C. The primary antibodies used in this study include PGC1α 1:100 (Santa Cruz Biotechnology, catalog no. 518025), CPT1A 1:100 (Proteintech, catalog no. 15184-I-AP), Paf1 1:100 (developed in-house), CD133 1:100 (RRID:AB_470302), Smad4 1:100 (Santa Cruz Biotechnology, catalog no. sc7966), NRF1 1:300 (RRID:AB_2766328), anti-mouse c-Kit 1:100 (eBioscience, catalog no. 11-1171-81), non-phospho active β-catenin 1:100 (Cell Signaling Technology, catalog no. 8814S), PPARG 1:100 (RRID:AB_10985650), and ALDH1A1 1:100 (RRID:AB_10917910). We also used conjugated lectins, UEA1-FITC, PNA-Rhodamine 1:100 (Vector, catalog no. RL-1072), and DBA-FITC 1:100 (Vector, catalog no. FL-1031). After washing in PBS, tissue slides were incubated with fluorophore-conjugated secondary antibody for 1 hour at room temperature. Slides were washed in PBS and mounted with Vectashield containing DAPI. Whole-mount immunofluorescence staining for organoid cultures was performed as shown previously (15). Fluorescent images were captured using an LSM 710 confocal microscope and analyzed using ZEN software. For immunofluorescence on cells, we used Mitotracker Deep Red FM (Thermo Fisher Scientific, catalog no. M22426).
Quantitative PCR
Total RNA was isolated using the RNeasy mini kit (Qiagen 74106) according to the manufacturer's instructions. Reverse transcription was performed from 2 μg of total RNA utilizing a SuperScript II cDNA synthesis kit (Invitrogen, 18064-014). Quantitative PCR was performed using SYBR Green dye (Roche 04887352001) using a CFX Connect Real-Time PCR detection system (Bio-Rad, 1855200). Reactions were performed in triplicate, and β-actin was used as a control. Primers used are listed in Supplementary Table S1.
Seahorse extracellular flux analysis of extracellular acidification rate and oxygen consumption rate
Extracellular acidification rate (ECAR), oxygen consumption rate (OCR), and FAO-OCR were measured as we performed previously (11). Briefly, 10,000 cells were plated in XF96 cell culture microplates (Seahorse Biosciences, catalog no. 101104-004) in the respective growth medium. After 24 hours, the growth medium was replaced with XF assay medium (Seahorse Biosciences, catalog no. 102365-100) followed by incubation at 37°C for 1 hour in a CO2-free incubator. The basal ECAR and the ECAR following the addition of glucose (10 mmol/L), oligomycin (1 μmol/L), and 2-deoxyglucose (50 mmol/L) were measured using an XF96 extracellular flux analyzer (Seahorse Biosciences) by following the manufacturer's protocol. The ECAR values were normalized to total cell counts in each well. The basal OCR and the OCR following the addition of oligomycin (1 μmol/L), FCCP (0.5 μmol/L), and rotenone/antimycin A (0.5 μmol/L) were measured using an XF96 extracellular flux analyzer (Seahorse Biosciences) by following the manufacturer's protocol. The ECAR values were normalized to total cell counts in each well. FAO-OCR was measured by the XF Cell Mito Stress Test (catalog no. 103015-100) using the XF Palmitate-BSA FAO substrate (catalog no. 102720-100) in the presence or absence of etomoxir, an inhibitor of CPT1A, according to the manufacturer's instructions. The OCR values were normalized to total cell counts in each well.
Bioinformatics
Two NCBI Gene Expression Omnibus (GEO) datasets (GSE19650 and GSE43288) including clinical samples of the normal pancreas (NP), intraductal papillary mucinous adenomas (IPMA or IPMN with low-grade dysplasia), intraductal papillary mucinous carcinomas (IPMC or IPMN with high-grade dysplasia), invasive ductal carcinomas (IDC) arising in IPMNs (IDC-IPMN), PanINs, and PanIN-derived PDAC were selected to investigate the differential transcriptomic signatures of stemness and metabolic genes. The data were processed by quantile normalization and log2 transformation. Network analysis was performed by importing fold changes of differentially expressed genes (IPMN vs. NP or PanIN vs. NP) using Ingenuity pathway analysis (IPA) software (RRID:SCR_008653).
Statistical analysis
Statistical analysis was performed using GraphPad Prism. Data are presented as the mean ± SD or mean ± SEM. Significance was determined using a simple Student t test and Dunnett multiple comparisons test. Protein–protein interactions of PGC1α were analyzed using “STRING” (https://string-db.org; RRID:SCR_005223).
Results
A meta-analysis of metabolic and stemness genes in clinical samples of IPMN- and PanIN-mediated PDAC progression
We investigated the metabolic and stemness gene expression patterns of IPMNs and PanINs, using the gene expression profile data (GSE19650 and GSE43288) from the NCBI GEO database. The GSE19650 dataset contains 7 samples of NP ducts, 6 IPMAs (or IPMN with low-grade dysplasia), 6 intraductal papillary mucinous carcinomas (IPMC or IPMN with high-grade dysplasia), and 3 IDCs arising in IPMNs (IDC-IPMN or IPMN-PDAC). The GSE43288 dataset contains 20 samples, including 3 NP, 13 PanIN, and 4 PDAC (PanIN-derived PDAC or PanIN-PDAC) samples. Datasets were processed using standard GEO2R analysis, followed by quantile normalization and log2 transformation. The expression levels of genes encoding glycolytic and Warburg effect enzymes were not significantly elevated in IPMA, IPMC, and IPMN-PDAC samples compared with NP (Fig. 1A–G). The expression levels of genes that encode OXPhos enzymes such as IDH1, MDH1, NDUFS2, and UQCRC1 were increased in different stages of IPMN compared with NP (Fig. 1H–K). Interestingly, significant upregulation of PPARGC1A (PGC1α) and downregulation of cMyc were observed in IPMA, IPMC, and IPMN-PDAC samples compared with NP (Fig. 1L and M). Furthermore, IPMC and IPMN-PDAC samples showed significantly higher expression of CPT2, a gene that encodes an enzyme that regulates the rate-limiting step of FAO (Fig. 1N). Glycolytic genes showed significantly elevated expressions in PanIN-derived PDAC; however, the expression of these genes did not vary substantially in PanINs compared with NP (Fig. 1O–U). Unlike in IPMN, expression levels of PPARGC1A and FAO genes CPT1A and ACADS were not significantly different in PanINs and PanIN-derived PDAC compared with NP (Fig. 1V,–X). Overall, this metadata analysis suggests that IPMN samples exhibit a PGC1α/FAO-dependent OXPhos signature, while PanINs do not. Regarding stemness genes, IPMN and PanIN samples showed significantly elevated (P < 0.05) expression levels of PROM1, ALDH2, LIF, NANOG, and KLF4. In addition, KIT, NOTCH2, and CD34 stemness genes were significantly and exclusively elevated in PanINs, while the expression levels of CTNNB1 and ALDH3A1 increased exclusively in IPMNs (Fig. 1Y; Supplementary Fig. S1A and S1B). IPA of differentially expressed stemness and metabolic genes from the IPMN datasets followed by network generation showed an association of PGC1α with stemness, OXPhos, and FAO genes in IPMNs (Fig. 1Z).
Expressions of key metabolic regulators, PGC1α, and CPT1A in different precursor lesions of PDAC progression
Because our meta-analysis showed differential expression of PGC1α and CPT1A in PanINs and IPMNs, we performed TMA analysis of these markers using IHC. The TMAs contain tissue samples of NP (n = 6), CP (n = 15), PanIN1 (n = 8), PanIN2 (n = 3), PanIN3 (n = 6), PanIN-derived PDAC (PanIN-PDAC or PDAC; n = 34), and pancreatic cystic neoplasms (PCN), including IPMN (n = 27), PDAC arising in IPMN (IPMN-PDAC; n = 27), serous cystic neoplasm (SC; n = 31), and mucinous cystic neoplasms (MCN; n = 21). The immunostaining showed that the NP expresses higher cytoplasmic and nuclear levels of PGC1α (Fig. 2A). However, a significant decrease (P < 0.001) in PGC1α expression was identified in PanIN1 samples (P < 0.001; Fig. 2A and B) compared with NP. However, PGC1α expression was gradually recovered in PanIN2 and PanIN3, followed by a complete reappearance in PDAC (Fig. 2A and B). Although we observed a reduced PGC1α expression in PanIN1 samples compared with NP, PanIN1 cells still retained low PGC1α expression (Fig. 2A). In contrast, we found a significant increase (P < 0.02) in cytoplasmic and nuclear PGC1α staining in IPMN and IPMN-PDAC compared with NP (Fig. 2A). In addition, PGC1α expression localized differently in PanIN and IPMN. PGC1α expression was higher in the cytoplasm and lower in the nucleus of PanIN2; however, its expression was higher in both the cytoplasm and nucleus in IPMN (Fig. 2C). On the other hand, SCs and MCNs maintained the same levels of PGC1α expression as observed in NP (Fig. 2A and B).

Differential expression of metabolic regulators, PGC1α and CPT1A, in different stages of PDAC development. A–F, IHC analysis of PGC1α (A–C) and CPT1A (D–F) in indicated samples. A histoscore was calculated by multiplying intensity and positivity. Data represent mean ± SD. P values were calculated using ordinary one-way ANOVA (multiple comparisons). The mean of each sample was compared with the mean of NP. Asterisks indicate a statistically significant difference between each sample and NP (∗, P < 0.05; ∗∗, P < 0.01; ∗∗∗, P < 0.001). Scale bar 200 μm. C and F, Magnified PanIN2 and IPMN regions duplicated from the original PanIN2 and IPMN IHC images of A and D to show the subcellular localization of PGC1α (C) and CPT1A (F) were shown.
Differential expression of metabolic regulators, PGC1α and CPT1A, in different stages of PDAC development. A–F, IHC analysis of PGC1α (A–C) and CPT1A (D–F) in indicated samples. A histoscore was calculated by multiplying intensity and positivity. Data represent mean ± SD. P values were calculated using ordinary one-way ANOVA (multiple comparisons). The mean of each sample was compared with the mean of NP. Asterisks indicate a statistically significant difference between each sample and NP (∗, P < 0.05; ∗∗, P < 0.01; ∗∗∗, P < 0.001). Scale bar 200 μm. C and F, Magnified PanIN2 and IPMN regions duplicated from the original PanIN2 and IPMN IHC images of A and D to show the subcellular localization of PGC1α (C) and CPT1A (F) were shown.
Owing to the association of PGC1α with CPT1A (16–24), we sought to analyze CPT1A expression in PDAC progression samples. Compared with NP, CPT1A IHC staining was lower in PanIN1 and not significantly elevated in PanINs; however, its staining was significantly increased (P < 0.0001) in IPMNs (Fig. 2D and E). Interestingly, both PanIN-PDAC and IPMN-PDAC expressed significantly higher (P < 0.0001) levels of CPT1A (Fig. 2D and E). The other PCNs, SC and MCN, showed increased staining for CPT1A compared with NP (P < 0.0001; Fig. 2D and E). PanIN and IPMN demonstrated differential subcellular localization of CPT1A expression. Faint CPT1A expression (not significant compared with NP) was localized to the cytoplasm in PanIN2, while IPMN demonstrated higher expression, localized to both the cytoplasm and nucleus (Fig. 2F). These observations suggest that the expression of the FAO signature gene, CPT1A, is augmented in IPMN.
Stem cell signatures of ADM/PanINs and IPMN precursor lesions
To identify the stemness signature elevated during ADM/PanIN development, we induced ADM in wild-type (WT) and KRASG12D; Pdx-1 Cre (KC) mice by treating them with 8 hourly intraperitoneal cerulean injections (75 μg/kg body weight) on 2 alternate days (Fig. 3A). The mice were sacrificed 2 days after the last day of injection, and primary pancreatic cells were isolated. Isolated cells (Supplementary Fig. S2A and B) were stained with FITC-conjugated Ulex Europaeus Agglutinin I (UEA1; an acinar specific marker) and CD133 antibody, followed by sorting of acinar cells (UEA1+CD133−), AD cells (UEA1+CD133+), and ductal cells (UEA1−CD133+; Fig. 3B). The percentage of AD cells was significantly higher with cerulean treatment than in controls (Fig. 3B and C). As expected, AD cells showed the loss of acinar cell markers, Amy1 and Cpa1, but gained the Krt19+ and Sox9+ phenotype (Fig. 3D). The presence of Ptf1a, a promoter of acinar fate in AD cells even after the loss of Amy1 and Cpa1, confirms the intermediate de-differentiated state of the AD cells (Fig. 3D). mRNA expression levels of stemness markers, Aldh1a1, Prom1 (cd133), Paf1, and Epcam, were higher in sorted AD cells than acinar cells (Fig. 3E and F). Besides, cerulean-induced AD cells showed a significantly increased sphere formation ability, suggesting that the AD cells display stemness characteristics (Fig. 3G and H). Furthermore, the induction of ADM in the pancreas of cerulean-treated WT mice was confirmed by immunofluorescence using ductal-specific FITC-conjugated lectin, Dolichos biflorus agglutinin (DBA), rhodamine-conjugated acinar-specific lectin, peanut agglutinin (PNA), FITC-conjugated acinar-specific lectin, UEA1, and antibodies for CD133 and PAF1 stemness markers (5). The pancreas tissue of cerulean-treated WT mice showed a loss of PNA or UEA1 staining and increased DBA or CD133 staining compared with pancreas from untreated mice, suggesting cerulean treatment-induced ADM (Fig. 3I; Supplementary Fig. S3A). We also found a reduced PAF1 expression in the cerulean-treated pancreas compared to control; however, the AD (PNA+DBA+ or CD133+UEA1+) cells still retained nuclear and cytoplasmic PAF1 expression, indicating stemness features (ref. 14; Fig. 3I; Supplementary Fig. S3A and S3B). AldeRed assay also showed that the cerulean-induced AD cells had increased ALDH activity versus that in acinar cells from the untreated pancreas (Supplementary Fig. S3C). Interestingly, the AD cells sorted from cerulean-treated KC mice (6 weeks old; Supplementary Fig. S4) showed elevated expression of Kit and decreased expression of Ctnnb1 compared with untreated KC pancreas (Fig. 3J). Immunofluorescence staining also showed increased staining for cKIT and decreased staining of non-phospho active β-catenin (Fig. 3K) in pancreas tissues harvested from 6-week-old cerulean-treated KC mice compared with untreated KC mice. Flow cytometry analysis showed an augmented percentage of cKIT+ cells in AD cells compared with acinar cells of KC mice (7 weeks old; Supplementary Fig. S5). PanIN lesions of 10-week-old KC mice also showed a co-overexpression of cKIT and CD133 and decreased staining for non-phospho active β-catenin compared with the NP (Fig. 3L).

ADM/PanIN and IPMN show stemness features. A, Schematic depicting the strategy used to develop cerulean-induced mouse model. B, Representative flow cytometry plots of acinar, AD, and ductal populations in pancreatic cells isolated from PBS- or cerulean-treated WT mice stained with CD133 PE-Cy7 and UEA1-FITC. C, The percentage of AD (UEA1+CD133+), ductal (UEA1−CD133+), and acinar (UEA1+CD133−) populations as analyzed by flow cytometry. D–F, Relative expression of indicated genes in acinar, AD, and ductal cells, analyzed by qRT-PCR. The PCR data were normalized with the Actb gene. Data represent mean ± SD (n = 3). G and H, Sphere assay in indicated samples. The histogram depicts the number of spheres (>50 μm). Data represent mean ± SD (n = 3). I, Immunofluorescence images of pancreas harvested from PBS- or cerulean-treated WT mice stained with UEA1-FITC, CD133, PAF1, and DAPI (as indicated). Scale bar 100 μm. J, Relative expression of indicated genes in acinar and AD cells, analyzed by qRT-PCR. The PCR data were normalized with the Actb gene. Data represent mean ± SD (n = 3). K and L, Immunofluorescence images of pancreas harvested from indicated mice stained with c-KIT, non-phospho active β-catenin, CD133, and DAPI (as indicated). Scale bar 50 μm. M, Western blot analysis for proteins indicated on the left using protein lysates from KC6141 (KC) and T161 (KC Smad4Loss). N and O, The histogram provides the percentage of ALDH+ cells analyzed by flow cytometry in KC and KC Smad4Loss cells. Representative flow cytometry plots of AldeRed assay for ALDH detection using a combination of Green laser (532 nm) with PE-Texas red detector (615 nm). P, Immunofluorescence images of KC and KC Smad4Loss pancreas tissues stained for CD133, Smad4, and DAPI (as indicated), and then examined by confocal microscopy (scale bar 100 μm). Q–S, Relative gene expression of Aldh1a1, Sox2, Gnas, Prom1, Pou5f1, Nanog, Dclk1 Ctnnb1, and Kit in indicated samples as analyzed by qRT-PCR. The PCR data were normalized with the Actb gene. T, Sphere assay images of indicated samples. Scale bar 400 μm. The histogram depicts the number of spheres (>50 μm). For all histograms, data represent mean ± SD (n = 6). P values were calculated by Student t test (∗, P < 0.05; ∗∗, P < 0.01; ∗∗∗, P < 0.001).
ADM/PanIN and IPMN show stemness features. A, Schematic depicting the strategy used to develop cerulean-induced mouse model. B, Representative flow cytometry plots of acinar, AD, and ductal populations in pancreatic cells isolated from PBS- or cerulean-treated WT mice stained with CD133 PE-Cy7 and UEA1-FITC. C, The percentage of AD (UEA1+CD133+), ductal (UEA1−CD133+), and acinar (UEA1+CD133−) populations as analyzed by flow cytometry. D–F, Relative expression of indicated genes in acinar, AD, and ductal cells, analyzed by qRT-PCR. The PCR data were normalized with the Actb gene. Data represent mean ± SD (n = 3). G and H, Sphere assay in indicated samples. The histogram depicts the number of spheres (>50 μm). Data represent mean ± SD (n = 3). I, Immunofluorescence images of pancreas harvested from PBS- or cerulean-treated WT mice stained with UEA1-FITC, CD133, PAF1, and DAPI (as indicated). Scale bar 100 μm. J, Relative expression of indicated genes in acinar and AD cells, analyzed by qRT-PCR. The PCR data were normalized with the Actb gene. Data represent mean ± SD (n = 3). K and L, Immunofluorescence images of pancreas harvested from indicated mice stained with c-KIT, non-phospho active β-catenin, CD133, and DAPI (as indicated). Scale bar 50 μm. M, Western blot analysis for proteins indicated on the left using protein lysates from KC6141 (KC) and T161 (KC Smad4Loss). N and O, The histogram provides the percentage of ALDH+ cells analyzed by flow cytometry in KC and KC Smad4Loss cells. Representative flow cytometry plots of AldeRed assay for ALDH detection using a combination of Green laser (532 nm) with PE-Texas red detector (615 nm). P, Immunofluorescence images of KC and KC Smad4Loss pancreas tissues stained for CD133, Smad4, and DAPI (as indicated), and then examined by confocal microscopy (scale bar 100 μm). Q–S, Relative gene expression of Aldh1a1, Sox2, Gnas, Prom1, Pou5f1, Nanog, Dclk1 Ctnnb1, and Kit in indicated samples as analyzed by qRT-PCR. The PCR data were normalized with the Actb gene. T, Sphere assay images of indicated samples. Scale bar 400 μm. The histogram depicts the number of spheres (>50 μm). For all histograms, data represent mean ± SD (n = 6). P values were calculated by Student t test (∗, P < 0.05; ∗∗, P < 0.01; ∗∗∗, P < 0.001).
To investigate the stemness signatures of IPMN, we used IPMN cell lines T161 and LGKC1 derived from the pancreas of KCSmad4− and doxycycline-inducible Kras; Gnas (KG) mouse models, respectively. T161 cells showed a loss of Smad4 and increased ALDH1A1 protein expression levels compared with control KC cells (KC6141; Fig. 3M). AldeRed analysis also showed a higher percentage of ALDH+ cells in T161 cells than in KC6141 cells (Fig. 3N and O). Immunofluorescence staining also showed increased expression of ALDH1A1 and CD133 stemness markers and decreased Smad4 in the IPMN regions of KCSmad4− pancreas tissues compared with KC control (Fig. 3P; Supplementary Fig. S6). mRNA expression of Aldh1a1 and Sox2 stemness markers was higher in T161 cells than in KC6141 (Fig. 3Q). Similarly, induction of Gnas in the LGKC1 cell line with doxycycline resulted in a marked upregulation of stemness genes such as Prom1, Sox2, Pou5f1, Nanog, Dclk1, and Ctnnb1 compared with untreated cells (Fig. 3R and S). However, the induction of Gnas in LGKC1 cells did not elevate Kit expression (Fig. 3S). Gnas induction also significantly increased the sphere formation ability of LGKC1 cells (Fig. 3T; Supplementary Fig. S7). Overall, these results suggest that stemness signatures are elevated in ADM/PanIN and IPMN.
Identification of FAO-dependent and FAO-independent OXPhos in IPMNs and ADM/PanINs, respectively
The meta-analysis and IHC analysis in previous sections suggest PGC1α and CPT1A are differentially expressed in IPMN and PanINs (Figs. 1 and 2). Consistent with these data, cerulean-induced pancreas tissues of KC mice showed a significant reduction in PGC1α expression compared with the pancreas tissue of vehicle-treated mice by IHC (Fig. 4A and B). Similarly, Ppargc1a and Cpt1a transcripts were decreased in the whole pancreas of cerulean-treated KC mice compared with control (Fig. 4C and D; Supplementary Fig. S8). Pancreatic cells isolated from cerulean-treated mice showed reductions in maximal respiration, spare respiratory capacity, glycolysis, glycolytic capacity, and FAO-mediated OXPhos (FAO-OXPhos) as analyzed by seahorse extracellular flux analyzer (Fig. 4E and I).

ADM/PanIN and IPMN show upregulation of PGC1α and display unique metabolic states. A and B, IHC analysis of PGC1α in PBS- or cerulean-treated KC pancreas samples. The histogram to the right shows the histoscore of PGC1α. Data represent mean ± SD (n = 3). Scale bar 200 μm. C and D, qRT- PCR analysis of PPARGC1A and CPT1A in indicated samples. The PCR data were normalized with the Actb gene. Data represent mean ± SD (n = 3). E and F, Maximal respiration and spare respiratory capacity reflected by OCR were measured using the Seahorse extracellular flux analyzer. Data are mean ± SEM (n = 6). G and H, Glycolysis and glycolytic capacity reflected by ECAR was measured in indicated samples using Seahorse extracellular flux analyzer. Data are mean ± SEM (n = 6). I, Maximal endogenous OCR due to FAO measured by XF Palmitate-BSA FAO Substrate with the XF Cell Mito Stress Test kit using the Seahorse extracellular flux analyzer. Data are mean ± SEM (n = 3). J and K, Immunofluorescence images of pancreas harvested from PBS- or cerulean-treated KC mice stained with PNA-Rhodamine, DBA-FITC, UEA1-FITC, CD133, PGC1α, CPT1A, and DAPI (as indicated). Scale bar 100 μm. L and M, qRT- PCR analysis of indicated genes in indicated samples. The PCR data were normalized with the Actb gene. Data represent mean ± SD (n = 3). N, Basal OCR was measured in acinar, AD, and ductal populations using XF Cell Mito Stress Test kit using the Seahorse extracellular flux analyzer. Data are mean ± SEM (n = 3). O, Immunofluorescence images of pancreas harvested from 10-week-old KC and WT mice stained with CD133, PGC1α, cKIT, and DAPI (as indicated). Scale bar 50 μm. P, qRT- PCR analysis of indicated genes in LGKC1 control and doxycycline (Dox)-induced samples. The PCR data were normalized with the Actb gene. Data represent mean ± SD (n = 3). Q, OCR was measured following the addition of oligomycin (O; 1 μmol/L), FCCP (F; 0.5 μmol/L), and electron transport inhibitor rotenone/antimycin A (R/A; 0.5 μmol/L). Data are mean ± SD (n = 6). R, ECAR was measured following the addition of glucose (Glc; 10 mmol/L), oligomycin (O; 1 μmol/L), and 2-deoxyglucose (2DG; 50 mmol/L). Data are mean ± SEM (n = 6). S, Immunofluorescence images of human IPMN organoids stained with PGC1α, CPT1A, and DAPI (as indicated). Scale bar 50 μm.
ADM/PanIN and IPMN show upregulation of PGC1α and display unique metabolic states. A and B, IHC analysis of PGC1α in PBS- or cerulean-treated KC pancreas samples. The histogram to the right shows the histoscore of PGC1α. Data represent mean ± SD (n = 3). Scale bar 200 μm. C and D, qRT- PCR analysis of PPARGC1A and CPT1A in indicated samples. The PCR data were normalized with the Actb gene. Data represent mean ± SD (n = 3). E and F, Maximal respiration and spare respiratory capacity reflected by OCR were measured using the Seahorse extracellular flux analyzer. Data are mean ± SEM (n = 6). G and H, Glycolysis and glycolytic capacity reflected by ECAR was measured in indicated samples using Seahorse extracellular flux analyzer. Data are mean ± SEM (n = 6). I, Maximal endogenous OCR due to FAO measured by XF Palmitate-BSA FAO Substrate with the XF Cell Mito Stress Test kit using the Seahorse extracellular flux analyzer. Data are mean ± SEM (n = 3). J and K, Immunofluorescence images of pancreas harvested from PBS- or cerulean-treated KC mice stained with PNA-Rhodamine, DBA-FITC, UEA1-FITC, CD133, PGC1α, CPT1A, and DAPI (as indicated). Scale bar 100 μm. L and M, qRT- PCR analysis of indicated genes in indicated samples. The PCR data were normalized with the Actb gene. Data represent mean ± SD (n = 3). N, Basal OCR was measured in acinar, AD, and ductal populations using XF Cell Mito Stress Test kit using the Seahorse extracellular flux analyzer. Data are mean ± SEM (n = 3). O, Immunofluorescence images of pancreas harvested from 10-week-old KC and WT mice stained with CD133, PGC1α, cKIT, and DAPI (as indicated). Scale bar 50 μm. P, qRT- PCR analysis of indicated genes in LGKC1 control and doxycycline (Dox)-induced samples. The PCR data were normalized with the Actb gene. Data represent mean ± SD (n = 3). Q, OCR was measured following the addition of oligomycin (O; 1 μmol/L), FCCP (F; 0.5 μmol/L), and electron transport inhibitor rotenone/antimycin A (R/A; 0.5 μmol/L). Data are mean ± SD (n = 6). R, ECAR was measured following the addition of glucose (Glc; 10 mmol/L), oligomycin (O; 1 μmol/L), and 2-deoxyglucose (2DG; 50 mmol/L). Data are mean ± SEM (n = 6). S, Immunofluorescence images of human IPMN organoids stained with PGC1α, CPT1A, and DAPI (as indicated). Scale bar 50 μm.
Interestingly, PGC1α expression in KC mouse pancreas was reduced with cerulean treatment at the whole pancreas level (compared with control), while a small proportion of UEA1+ CD133+ AD cells still retained its expression (Fig. 4J). However, cerulean-treated AD (PNA+DBA+) cells did not show CPT1A expression (Fig. 4K). In addition, cerulean-induced and FACS-sorted AD cells showed increased mRNA levels of Ppargc1a and OXPhos genes (Dlat and Aco1) but reduced levels of Cpt1a compared with acinar cells (Fig. 4L and M). Analysis of OCR using Seahorse extracellular flux analyzer showed that basal OCR was elevated in AD cells (Fig. 4N). PGC1α was co-overexpressed with cKIT and CD133 in PanIN lesions of the 10-week-old KC mouse pancreas compared with age-matched WT control (Fig. 4O). The pancreas of 10-week-old KC mice also showed elevated DLAT expression with no CPT1A staining (Supplementary Fig. S9). These data suggest that the PanIN lesions and cerulean-induced AD cells express PGC1α and utilize FAO-independent OXPhos.
In contrast, Gnas induction in LGKC1 with doxycycline treatment (10 ng/mL) increased the mRNA levels of Ppargc1a, Cs, and FAO genes (Cpt1a, Cpt1b, Cpt1c, Acads) but decreased levels of Pdk1 compared with untreated LGKC1 (Fig. 4P). Seahorse analysis showed that doxycycline treatment also elevated OCR levels in LGKC1 cells (Fig. 4Q) but not in KC control cells (KC6141; Supplementary Fig. S10). Also, palmitate increased OCR only in doxycycline-induced LGKC1 cells but not in control LGKC1 cells (Fig. 4Q). However, Gnas induction did not affect ECAR values compared with LGKC1 control cells (Fig. 4R). Furthermore, human IPMN organoids showed co-expression of CPT1A and PGC1α (Fig. 4S). Overall, these results indicate that IPMNs have FAO-dependent OXPhos and PGC1α expression.
ADM/PanINs and IPMN lesions upregulate unique PGC1α-interacting partners
The “STRING” software analysis of PGC1α protein–protein interactions showed the possible interaction of PGC1α with other co-receptors, including NRF1, PPARA, PPARG, NR1H3, ESRRA, RXRA, SIRT1, and CPT1A (Fig. 5A). Gene expression analysis of the IPMN progression dataset (GSE19650) showed significant upregulation of PPARG and NRF1 in IPMNs (Fig. 5B and C). Other PGC1α-interacting partners did not show upregulation in IPMN samples compared with the NP (Fig. 5D–I). The AD cells sorted from the pancreas cells of the cerulean-treated KC mice (6 weeks old) showed increased Nrf1 and decreased Pparg expression compared with acinar cells (Fig. 5J). Co-expression of PGC1α with PPARγ (PPARG) was observed in human IPMN organoids (Fig. 5K). PGC1α was upregulated and coexpressed with nuclear PPARγ in doxycycline-induced LGKC1 cells and with nuclear as well as cytoplasmic NRF1 in cerulean-induced AD cells of KC mice (Fig. 5L–N). PanIN lesions of 10-week-old KC mice also showed co-expression of PGC1α with NRF1 (Fig. 5O). These data collectively suggest that ADM/PanINs and IPMNs overexpress PGC1α-interacting partners, NRF1 and PPARγ, respectively.

ADM/PanIN and IPMN show the upregulation of unique PGC1α-interacting partners. A, Protein–protein interactions analysis of PPARGC1A using “STRING” software. B–I, A meta-analysis of genes that encode PGC1α-interacting proteins using the human IPMN progression dataset GSE19650. Datasets were processed using standard GEO2R analysis, followed by quantile normalization and log2 transformation. Data represent mean ± SD. P values were calculated using ordinary one-way ANOVA (multiple comparisons). The mean of each sample was compared with the mean of NP. Asterisks indicate a statistically significant difference between each sample and NP. J, qRT-PCR analysis of indicated genes in acinar and AD cells. The PCR data were normalized with the Actb gene. Data represent mean ± SD (n = 3). K and L, Immunofluorescence images with PGC1α, PPARγ, and DAPI staining on indicated samples. M and N, Immunofluorescence images. NRF1 staining along with DAPI on pancreatic tissues harvested from control (KC) and cerulean-treated KC (KC+Cer) mouse (M). The KC+Cer immunofluorescence image, which was shown for NRF1 staining in M (bottom image), was further showed for the co-expression of NRF1 with PGC1α (N, bottom images). The co-expression of NRF1 with PGC1α was shown in another KC+Cer tissue section (N, top images). O, Immunofluorescence images with PGC1α, NRF1, and DAPI staining on indicated samples. Scale bar 50 μm. For all histograms, P values were calculated by Student t test (∗, P < 0.05; ∗∗, P < 0.01; ∗∗∗, P < 0.001.)
ADM/PanIN and IPMN show the upregulation of unique PGC1α-interacting partners. A, Protein–protein interactions analysis of PPARGC1A using “STRING” software. B–I, A meta-analysis of genes that encode PGC1α-interacting proteins using the human IPMN progression dataset GSE19650. Datasets were processed using standard GEO2R analysis, followed by quantile normalization and log2 transformation. Data represent mean ± SD. P values were calculated using ordinary one-way ANOVA (multiple comparisons). The mean of each sample was compared with the mean of NP. Asterisks indicate a statistically significant difference between each sample and NP. J, qRT-PCR analysis of indicated genes in acinar and AD cells. The PCR data were normalized with the Actb gene. Data represent mean ± SD (n = 3). K and L, Immunofluorescence images with PGC1α, PPARγ, and DAPI staining on indicated samples. M and N, Immunofluorescence images. NRF1 staining along with DAPI on pancreatic tissues harvested from control (KC) and cerulean-treated KC (KC+Cer) mouse (M). The KC+Cer immunofluorescence image, which was shown for NRF1 staining in M (bottom image), was further showed for the co-expression of NRF1 with PGC1α (N, bottom images). The co-expression of NRF1 with PGC1α was shown in another KC+Cer tissue section (N, top images). O, Immunofluorescence images with PGC1α, NRF1, and DAPI staining on indicated samples. Scale bar 50 μm. For all histograms, P values were calculated by Student t test (∗, P < 0.05; ∗∗, P < 0.01; ∗∗∗, P < 0.001.)
PGC1α controls stemness through FAO-dependent and FAO-independent OXPhos in IPMN and ADM/PanINs, respectively
We first sought to examine the role of PGC1α in pancreatic tumorigenesis. For this, we generated Colo357 PDAC cells and LGKC1 cells (Fig. 6A; Supplementary Fig. S11A) with stable PGC1α KD using a PGC1α shRNA followed by subcutaneous implantation in nude mice. A significant decrease in tumor weight and tumor volume was observed in the PGC1α KD groups compared with scramble control (Supplementary Fig. S11B-S11D; Fig. 6B). KD of PGC1α reduced the expression of the ALDH1A1 stemness marker in Colo357 cells (Supplementary Fig. S11A). Similarly, PGC1α KD in LGKC1 cells reduced Gnas-induced overexpression of stemness genes (Prom1 and Ctnnb1) and FAO gene, Cpt1a (Fig. 6C). We also inhibited PGC1α expression in LGKC1 cells using its selective inhibitor, SR18292. SR18292 increases the interaction between GCN5, an acetyltransferase, and PGC1α, increasing its acetylation and inhibition (25). SR18292 has been shown to diminish tumor growth by inhibiting PGC1α-mediated OXPhos in multiple myeloma (26), and ameliorate diabetes (27) without signs of toxicity. Treatment of LGKC1 cells with SR18292 increased the levels of acetylated PGC1α (Supplementary Fig. S12). Our data showed that SR18292 corrected the OCR levels increased by the addition of palmitate in Gnas-induced LGKC1 cells, indicating that PGC1α contributes to the elevation of Gnas-induced FAO-OXPhos (Fig. 6D–F). However, SR18292 did not affect glycolysis and glycolytic capacity (Supplementary Fig. S13A and S13B). Interestingly, SR18292 significantly reduced the effects of Gnas on Prom1 expression (Supplementary Fig. S14), sphere formation ability (Supplementary Fig. S15A and S15B), and size of human IPMN organoids (Fig. 6G and H; Supplementary Fig. S16). Furthermore, SR18292 decreased Gnas-induced PGC1α and PPARγ levels (Supplementary Fig. S17). Immunofluorescence staining on human IPMN organoids showed that treatment with SR18292 reduced the expression of PGC1α, CPT1A, and PPARγ (Fig. 6I and J). On the other hand, SR18292 significantly reduced the number of duct-like structures in 3D Matrigel cultures of primary pancreatic acinar cells isolated from 9-week-old KC mice (Fig. 6K). It also reduced gene expression of ductal marker (Krt19), stemness markers (Kit and Prom1), and OXPhos marker (Dlat; Fig. 6L). Similarly, SR18292 treatment significantly inhibited the sphere-forming capacity of cerulean-induced AD cells (Fig. 6M), along with staining for Mitotracker Deep Red FM (a dye that stains mitochondrial mass; Fig. 6N). To conclude, PGC1α controls stemness signatures through FAO-dependent and FAO-independent OXPhos in IPMNs and ADMPanINs, respectively (Fig. 7).
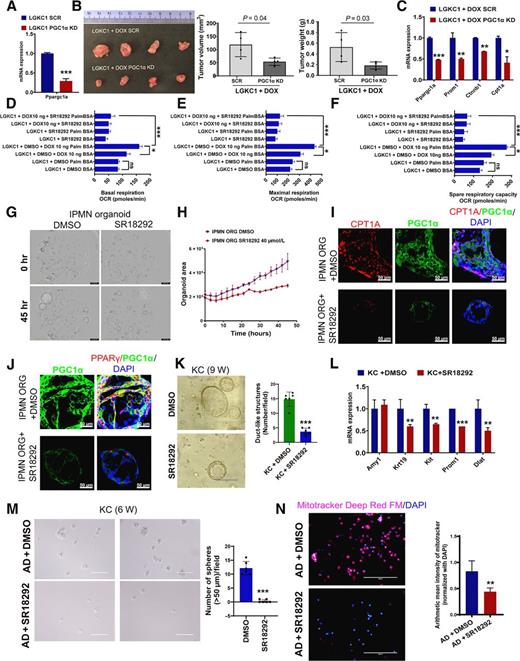
PGC1α-mediated OXPhos and FAO-OXPhos regulate stemness in ADM/PanIN and IPMN, respectively. A, qRT-PCR analysis of Ppargc1a in the scramble and PGC1α KD in LGKC1 cells. The PCR data were normalized with the Actb gene. Data represent mean ± SD (n = 3). B, LGKC1 SCR and PGC1α KD cells were injected subcutaneously into nude mice and maintained with doxycycline (DOX) in water. The subcutaneous tumors were excised 21 days after implantation, followed by the measurement of tumor volume and weight (bar graphs). Data are mean ± SD (n = 4). The significance was determined by a t test (∗, P < 0.05; ∗∗, P < 0.01; ∗∗∗, P < 0.001). C, qRT-PCR analysis of indicated genes in the scramble and PGC1α KD LGKC1+DOX cells. The PCR data were normalized with the Actb gene. Data represent mean ± SD (n = 3). D–F, Basal, maximal respiration, and spare respiratory capacity reflected by OCR due to FAO measured by XF Palmitate-BSA FAO Substrate with the XF Cell Mito Stress Test kit using the Seahorse extracellular flux analyzer. Data are mean ± SEM (n = 3). G and H, Morphology of human IPMN organoids growing in the presence and absence of SR18292. Organoid growth was monitored in the Incucyte Live-Cell Imaging analysis system, which captured images once every 3 hours. Data represent mean ± SEM (n = 3). I and J, Immunofluorescence images of human IPMN organoids stained with PGC1α, PPARγ, CPT1A, and DAPI (as indicated). Scale bar 50 μm. K, 3D Matrigel culture of pancreatic cells isolated from 9-week-old KC mouse pancreas and treated with DMSO or SR18292. The bar graph shows the number of duct-like structures per field. Data represent mean ± SD (n = 6 fields). L, qRT-PCR analysis of indicated genes in DMSO- or SR18292-treated KC pancreatic cells cultured in 3D Matrigel. The PCR data were normalized with the Actb gene. Data represent mean ± SD (n = 3). M, Sphere assay in AD cells sorted from the pancreatic cells of cerulean-treated KC mice. The AD cells were treated with SR18292 at 40 μmol/L for 7 days, followed by sphere count (>50 μm) and imaging analysis. The histogram to the right of sphere images depicts the number of spheres (>50 μm) in indicated samples. Data represent mean ± SD (n = 4). N, Immunofluorescence staining with Mitotracker Deep Red FM and DAPI in SR18292-treated and untreated AD cells sorted from the pancreatic cells of cerulean-treated KC mice. The histogram to the right depicts the arithmetic mean intensity of Mitotracker staining normalized with total DAPI staining. Data represent mean ± SD (n = 8 random images). For all histograms, P values were calculated by Student t test. (∗, P < 0.05; ∗∗, P < 0.01; ∗∗∗, P < 0.001.)
PGC1α-mediated OXPhos and FAO-OXPhos regulate stemness in ADM/PanIN and IPMN, respectively. A, qRT-PCR analysis of Ppargc1a in the scramble and PGC1α KD in LGKC1 cells. The PCR data were normalized with the Actb gene. Data represent mean ± SD (n = 3). B, LGKC1 SCR and PGC1α KD cells were injected subcutaneously into nude mice and maintained with doxycycline (DOX) in water. The subcutaneous tumors were excised 21 days after implantation, followed by the measurement of tumor volume and weight (bar graphs). Data are mean ± SD (n = 4). The significance was determined by a t test (∗, P < 0.05; ∗∗, P < 0.01; ∗∗∗, P < 0.001). C, qRT-PCR analysis of indicated genes in the scramble and PGC1α KD LGKC1+DOX cells. The PCR data were normalized with the Actb gene. Data represent mean ± SD (n = 3). D–F, Basal, maximal respiration, and spare respiratory capacity reflected by OCR due to FAO measured by XF Palmitate-BSA FAO Substrate with the XF Cell Mito Stress Test kit using the Seahorse extracellular flux analyzer. Data are mean ± SEM (n = 3). G and H, Morphology of human IPMN organoids growing in the presence and absence of SR18292. Organoid growth was monitored in the Incucyte Live-Cell Imaging analysis system, which captured images once every 3 hours. Data represent mean ± SEM (n = 3). I and J, Immunofluorescence images of human IPMN organoids stained with PGC1α, PPARγ, CPT1A, and DAPI (as indicated). Scale bar 50 μm. K, 3D Matrigel culture of pancreatic cells isolated from 9-week-old KC mouse pancreas and treated with DMSO or SR18292. The bar graph shows the number of duct-like structures per field. Data represent mean ± SD (n = 6 fields). L, qRT-PCR analysis of indicated genes in DMSO- or SR18292-treated KC pancreatic cells cultured in 3D Matrigel. The PCR data were normalized with the Actb gene. Data represent mean ± SD (n = 3). M, Sphere assay in AD cells sorted from the pancreatic cells of cerulean-treated KC mice. The AD cells were treated with SR18292 at 40 μmol/L for 7 days, followed by sphere count (>50 μm) and imaging analysis. The histogram to the right of sphere images depicts the number of spheres (>50 μm) in indicated samples. Data represent mean ± SD (n = 4). N, Immunofluorescence staining with Mitotracker Deep Red FM and DAPI in SR18292-treated and untreated AD cells sorted from the pancreatic cells of cerulean-treated KC mice. The histogram to the right depicts the arithmetic mean intensity of Mitotracker staining normalized with total DAPI staining. Data represent mean ± SD (n = 8 random images). For all histograms, P values were calculated by Student t test. (∗, P < 0.05; ∗∗, P < 0.01; ∗∗∗, P < 0.001.)

Discussion
PDAC is one of the most lethal diseases, and its high mortality rate is due to a lack of specific early diagnostic tools. Two major PPLs, ADM-PanIN and IPMN, are responsible for PDAC development; however, the early detection of these PPLs is still challenging as knowledge about the molecular signatures of these PPLs is inadequate (1). Extensive metabolic reprogramming and emergence of CSCs are two of several factors contributing to the aggressiveness of advanced PDAC. We and others have previously shown that the CSCs in advanced tumors exhibit specific metabolic signatures, and the inhibition of a particular metabolic program diminishes CSC survival (11, 12). We observed aerobic glycolysis, OXPhos, and FAO-OXPhos as the major metabolic signatures of pancreatic CSC populations (11). However, the stemness and metabolic signatures of PPLs and how they regulate the initiation events of PDAC are unknown. Here, we demonstrated that the ADM/PanINs and IPMNs show FAO-independent OXPhos and FAO-dependent OXPhos (FAO-OXPhos), respectively, correlating with specific stemness signatures. We showed that PGC1α-mediated OXPhos and FAO-OXPhos govern the specific stemness phenotype of PPLs. Also, PGC1α knockdown using shRNA or inhibition using SR18292 reduced in vivo tumorigenicity and repressed stemness features by targeting OXPhos and FAO-OXPhos in ADM/PanINs and IPMN, respectively.
Several lines of evidence suggest that CSCs play a critical role in the initiation and progression of PDAC (28, 29). CSCs share similar characteristics as normal stem or progenitor cells, such as self-renewal and multi-lineage differentiation. Recent lineage-tracing studies demonstrated that stem/progenitor cells with mutation(s) contribute to the initiation and development of cancers. For instance, APC-mutant Lgr5+ stem cells have been involved in the initiation and development of intestinal adenomas (6, 9). Aldh1b1- and Nestin-positive pancreatic stem/progenitor cells are highly responsive to Kras oncogenic activation and Kras-mediated tumorigenesis (7, 8). Despite these studies, the exact stemness signatures of ADM/PanINs and IPMN and how the stemness is regulated in PPLs are unknown. Our data showed that ADM/PanINs and IPMNs express overlapping sets of stemness genes. Both the PanINs and IPMNs overexpressed PROM1, ALDH2, LIF, NANOG, and KLF4. In addition, the ADM/PanINs showed a KIT, NOTCH2, and CD34 stemness signature, which did not include CTNNB1. In agreement with this observation, previous studies suggested that the loss of β-catenin is required for Kras-induced ADM and PanIN development (30, 31). In contrast, IPMNs showed an exclusive expression of CTNNB1 and ALDH3A1 stemness genes, in concordance with a previous study (32). Overall, ADM/PanINs and IPMN express specific stemness signatures.
Metabolic reprogramming is a significant event that occurs during cellular transformation (33). CSCs in advanced tumors are regulated by a specific metabolic program (12, 34–42). Our previous study identified significant upregulation of metabolic modulator PGC1α in pancreatic CSCs (11). Also, silencing of PGC1α in pancreatic CSCs reduced mitochondrial activity and CSC self-renewal, suggesting a critical role of PGC1α in pancreatic CSCs (12). The role of PGC1α in diabetes, obesity, and cardiovascular disease is well established (43); however, its importance in cancer has not been thoroughly explored. In breast cancer, increased PGC1α expression is associated with elevated metastasis and poor prognosis (44, 45). However, elevated PGC1α levels in prostate cancer are associated with low metastasis and a good prognosis (46). In melanoma, a PGC1α-high subpopulation showed increased OXPhos, reduced glycolysis, and low invasion, while PGC1α-low melanoma cells displayed decreased OXPhos, increased glycolysis, and elevated invasion (47, 48). However, the role of PGC1α in PDAC development and progression is unknown.
Our meta-analysis and TMA data followed by in vitro and in vivo validation studies suggested that the expression of PGC1α was significantly elevated in IPMN. In contrast, its expression was reduced in clinical samples of early PanINs (PanIN1) compared with the NP. However, PGC1α expression reappeared in PanIN3 and PanIN-derived PDAC. Interestingly, PanIN1 cells still maintained low PGC1α expression. These observations were recapitulated during cerulean-induced ADM and spontaneous PanIN development in the pancreas of mice with activated KrasG12D background. The PanINs and cerulean-induced ADM in mice with mutant Kras showed a reduced PGC1α expression compared with WT controls; however, a few AD metaplastic cells and PanINs still retained low PGC1α expression. A large body of evidence suggests that PanINs emerge during human and mouse PDAC development (49–52). In mouse models of PDAC development, ADM changes or ADM is often observed as a pre-precursor lesion of PanIN development (51, 53–57). A previous non-genetic in vitro lineage tracing study showed that human acinar cells could also differentiate into duct-like cells (54). Another study suggested that TGFβ could induce ADM in human pancreatic acinar cells in vitro (58). Despite these two pieces of evidence, the ADM process in human PDAC development is not well defined. The propensity of these AD metaplastic cells and PanIN cells (both expressing low PGC1α) to form advanced PanINs and subsequently progress to PDAC needs to be further explored in future studies.
Recent studies have demonstrated a clear correlation between the PGC1α/CPT1A axis and FAO-mediated OXPhos in diabetes, obesity, and cancer (16–24). Owing to the association of PGC1α with CPT1A, we analyzed CPT1A expression in PDAC progression samples. Interestingly, our meta- and IHC analyses revealed that CPT1A expression levels are elevated in IPMN but not in PanIN samples, suggesting the reliance of IPMNs on FAO-OXPhos. Interestingly, advanced PDAC samples of PanIN or IPMN origin showed increased levels of CPT1A expression, potentially due to the metabolic heterogeneity of these advanced tumors.
Further validation of these meta-analyses and IHC data using in vitro and in vivo models showed increased OXPhos and reduced CPT1A expression or FAO-OXPhos in AD metaplastic cells. The AD cells also showed elevated expression of DLAT, a gene that encodes the E2 component of the pyruvate dehydrogenase complex (PDC). The PDC catalyzes pyruvate conversion to acetyl coenzyme A, which enters the Krebs cycle. Further, PanIN lesions of 10-week-old KC mice showed elevated DLAT expression with low CPT1A expression. In contrast, IPMN showed elevated FAO-OXPhos and increased expression of FAO genes, CPT1A, CPT1B, CPT1C, and ACADS. These observations indicate that ADM/PanINs and IPMNs utilize FAO-independent and FAO-dependent OXPhos, respectively.
To examine whether PGC1α regulates the stemness programs and metabolic signatures of ADM/PanINs and IPMN, we knocked down PGC1α or inhibited its activity using SR18292. PGC1α KD significantly reduced in vivo tumorigenicity of PDAC and IPMN cells, suggesting a tumorigenic role of PGC1α. PGC1α KD also reduced the Gnas-induced stemness signature (CTNNB1 and CD133) and metabolic signature (CPT1A) of IPMN. Previous studies demonstrated that SR18292 disrupts OXPhos by acetylating PGC1α in multiple myeloma cells and chronic myeloid leukemia (CML) stem cells, leading to the inhibition of tumor growth (26, 59). Consistent with these studies, our findings showed that SR18292 acetylated PGC1α and inhibited FAO-OXPhos in IPMN. SR18292 also inhibited stemness signatures, including the expression of CD133 and self-renewal in IPMN, and reduced human IPMN organoid size. These data suggest that PGC1α-mediated FAO-OXPhos governs the specific stemness program in IPMN.
Because the mice with mutant Kras background begin to develop early PanINs spontaneously by 8–10 weeks of age (52, 60), we isolated primary pancreatic cells from 9-week-old KC mice, cultured them in 3D Matrigel, and treated them with SR18292. SR18292 reduced the number of duct-like structures and diminished the expression levels of ductal (Krt19), stemness (Kit and Prom1), and OXPhos (Dlat) genes. SR18292 also inhibited the mitochondrial mass and self-renewal of cerulean-induced AD cells. These data suggest that the PGC1α-mediated OXPhos regulates the stemness features of ADM/PanINs.
Our next goal was to delineate how PGC1α regulates two distinct metabolic pathways (FAO-independent and FAO-dependent) of ADM/PanINs and IPMN. PGC1α requires its coactivator proteins to regulate mitochondrial biogenesis, OXPhos, FAO-OXPhos, and CPT1A expression (17–24). In nasopharyngeal carcinoma, PGC1α has been shown to interact with CEBPB, inducing CPT1A expression and radiation resistance (16). Studies also showed that PGC1α interacts with NRF1 and regulates mitochondrial biogenesis and OXPhos. Through its interaction with PPARγ, PGC1α regulates FAO-OXPhos and CPT1A expression (60, 61). Our meta-analysis of human IPMN samples and gene expression analysis of mouse AD metaplastic cells showed an upregulation of PPARG and NRF1 in IPMN and ADM, respectively, accompanied by co-overexpression of PGC1α. Interestingly, the inhibition of PGC1α with SR18292 reduced the expression of PPARγ in IPMN, suggesting a strong association of PGC1α with PPARγ. Thus, our observations and previous studies indicate that PGC1α differentially regulates the unique metabolic programs of ADM/PanIN and IPMN by interacting with NRF1 and PPARγ, respectively: a concept that needs to be further explored.
In conclusion, this study identified specific metabolic signatures of two major PPLs, ADM/PanIN and IPMN, in PDAC development. We suggest for the first time that the central modulator of energy metabolism, PGC1α, regulates the specific stemness of the PPLs by upregulating specific metabolic programs. This study also showed for the first time in solid cancers that a selective PGC1α inhibitor, SR18292, can repress stemness by targeting OXPhos/FAO-OXPhos in these early events of PDAC progression. This study serves as a stepping stone for future research developing novel early PDAC detection tools and anti-CSC therapeutic strategies.
Authors' Disclosures
S.K. Batra is a co-founder of Sanguine Diagnostics and Therapeutics, Inc. No disclosures were reported by the other authors.
Authors' Contributions
R.K. Nimmakayala: Conceptualization, data curation, software, formal analysis, validation, visualization, methodology, writing–original draft. S. Rauth: Data curation, writing–review and editing. R. Chirravuri Venkata: Data curation, software, formal analysis, writing–review and editing. S. Marimuthu: Data curation, writing–review and editing. P. Nallasamy: Data curation, writing–review and editing. R. Vengoji: Data curation, writing–review and editing. S.M. Lele: Formal analysis, supervision, writing–review and editing. S. Rachagani: Data curation, writing–review and editing. K. Mallya: Resources, data curation, writing–review and editing. M.P. Malafa: Resources, supervision, writing–review and editing. M.P. Ponnusamy: Conceptualization, resources, supervision, funding acquisition, investigation, project administration, writing–review and editing. S.K. Batra: Conceptualization, resources, formal analysis, supervision, funding acquisition, validation, investigation, visualization, project administration, writing–review and editing.
Acknowledgments
We thank Corinn E. Grabow for all the technical support. We thank Craig Semerad, Victoria B. Smith, and Samantha Wall of the Flow Cytometry Research Facility, University of Nebraska Medical Center, for assisting with flow cytometry. We thank Anirban Maitra, MD Anderson Cancer Center, for providing the LGKC1 cell line. This work was supported, in part, by the NIH (P01 CA217798, R01 CA183459, R01 CA195586, R01 CA210637, U01 CA200466, and U01 CA210240). We thank Dr. Jessica Mercer for the editorial contribution to the article.
The costs of publication of this article were defrayed in part by the payment of page charges. This article must therefore be hereby marked advertisement in accordance with 18 U.S.C. Section 1734 solely to indicate this fact.