


Abstract
Purpose: A number of independent gene expression profiling studies have identified transcriptional subtypes in colorectal cancer with potential diagnostic utility, culminating in publication of a colorectal cancer Consensus Molecular Subtype classification. The worst prognostic subtype has been defined by genes associated with stem-like biology. Recently, it has been shown that the majority of genes associated with this poor prognostic group are stromal derived. We investigated the potential for tumor misclassification into multiple diagnostic subgroups based on tumoral region sampled.
Experimental Design: We performed multiregion tissue RNA extraction/transcriptomic analysis using colorectal-specific arrays on invasive front, central tumor, and lymph node regions selected from tissue samples from 25 colorectal cancer patients.
Results: We identified a consensus 30-gene list, which represents the intratumoral heterogeneity within a cohort of primary colorectal cancer tumors. Using a series of online datasets, we showed that this gene list displays prognostic potential HR = 2.914 (confidence interval 0.9286–9.162) in stage II/III colorectal cancer patients, but in addition, we demonstrated that these genes are stromal derived, challenging the assumption that poor prognosis tumors with stem-like biology have undergone a widespread epithelial–mesenchymal transition. Most importantly, we showed that patients can be simultaneously classified into multiple diagnostically relevant subgroups based purely on the tumoral region analyzed.
Conclusions: Gene expression profiles derived from the nonmalignant stromal region can influence assignment of colorectal cancer transcriptional subtypes, questioning the current molecular classification dogma and highlighting the need to consider pathology sampling region and degree of stromal infiltration when employing transcription-based classifiers to underpin clinical decision making in colorectal cancer. Clin Cancer Res; 22(16); 4095–104. ©2016 AACR.
See related commentary by Morris and Kopetz,
Recent molecular profiling studies in colorectal cancer have identified distinct subgroups with significant prognostic value. These studies have proposed the use of transcriptional-based companion diagnostic tests based on these prognostic subgroups. In stage II/III colorectal cancer, such diagnostic tests are urgently needed to inform clinical decision making in regard to administration of adjuvant therapy following surgery. The identification of a poor prognostic group has been associated with EMT- and stem-like traits, although detailed analysis of these tumors has revealed that the stromal-rich architecture of the tumor microenvironment informs their biology. In this study, we highlight the contrasting gene expression at multiple regions of colorectal cancer primary tumors due to intratumoral heterogeneity. This differential biology itself displays prognostic value and overlaps with the proposed diagnostic classifier signatures in colorectal cancer. Further to this, we highlight the potential for individual patient misclassification due to this regional heterogeneity using the recently proposed molecular classifiers.
Introduction
Colorectal cancer is the second leading cause of cancer-related deaths in the Western world. To date, the most powerful prognostic classification tool in colorectal cancer still relies on the tumor–node–metastasis staging system. Although histopathology is able to identify a number of factors that provide additional prognostic value and capture biologic aspects of important disease processes, (such as tumor morphology, grade and stage, lymphovascular invasion, and peritumoral inflammation), it gives no insight into the distinct biology that underpins colorectal cancer and determines disease outcome.
We and others have employed transcriptional profiling of clinically annotated tumor samples to gain molecular insights into colorectal cancer biology and thereby develop new patient stratification tools and identify novel therapeutic approaches (1–6). Using unsupervised classification of transcription data, independent groups have reported 3 to 6 molecular subgroups within colorectal cancer (2, 4, 7). Recent subtype concordance analysis by the Colorectal Cancer Subtyping Consortium (CRCSC) has yielded a consensus of 4 transcriptionally driven colorectal cancer molecular subgroups [Consensus Molecular Subtype (CMS 1–4)] with the following distinguishing features: CMS1, microsatellite instable (MI)/immune [frequency (f) = 14%); CMS2, canonical (f = 37%); CMS3, metabolic (f = 13%); and CMS4, mesenchymal (f = 23%; refs. 8, 9). Of these subgroups, the mesenchymal subtype (CMS4) has been found to be significantly associated with the worst prognosis in all studies. In addition, this gene signature has also been detected in serrated precursor lesions, suggesting that aggressive tumor traits may be “imprinted” in dysplastic tissue at the very earliest stage.
Many of the studies highlighted above (2, 4, 7) suggested that the identification of the CMS4 subtype was evidence of epithelial tumor cells undergoing changes associated with an extensive epithelial–mesenchymal transition (EMT), resulting in increased invasion and the acquisition of stem cell properties that are necessary for the establishment of metastases (10). Although the findings of these studies were independently validated, the cells-of-origin of individual transcriptional subtypes were not defined. More recently, two studies have indicated that mesenchymal tumors have an enriched stromal component, suggesting that the origin of the CMS4 signature may be dependent on the transcriptional profile originating from the stromal rather than the tumor compartment (11, 12). In this article, we build on these recent studies and provide important insights into the role of the colorectal tumor stroma, which may have significant implications for transcription-based classifiers as precision medicine tools for patient stratification.
Materials and Methods
Tissue samples
Upon receipt in the histopathology laboratory, fresh colon resection specimens (resected for tumor) were examined by a pathologist. Regions of interest (deep and superficial tumor) were identified using standard approaches and described for subsequent sampling. Specimens were then fixed in 10% neutral-buffered formalin, sampled, and, processed as per routine histology. Subsequent examination of 3-μm H&E–stained sections confirmed the presence of the identified regions of interest, and examination of further material from the same resection identified lymph nodes (LN) positive for tumor metastasis. The areas to be sampled were marked on the slides by a pathologist, and these were then used as a guiding template for macrodissection of 10-μm unstained tissue sections cut from the same block. Tissue of interest was scraped off the slide using a scalpel and a small amount of ethanol and placed in a labeled microcentrifuge tube.
Sample analysis
We selected samples from 25 patients (for clinical details, see Supplementary Table 1), where we had sufficient high-quality material to extract RNA from regions of interest. This resulted in 75 transcription profiles, 25 patients' samples at 3 regions per sample. These 75 samples were analyzed on the colorectal cancer disease-specific array (DSA) platform (Almac). Initial QC analysis of the microarray data found that 2 samples were outliers and were subsequently removed from further downstream analyses, resulting in 73 transcriptional profiles: 24 invasive front (IF), 24 central, and 25 LN deposits.
Data analysis and classifier generation
DSAs were read into the R statistical environment (version 3.1), background corrected and normalized using the justRMA function in the affy package. We initially assessed the profiles for dissimilarities by bootstrap hierarchical clustering to assess confidence in the groups and their distances by pvclust, allowing also for various nonspecific gene filtering levels by the package genefilter. From here, the limma package was used to assess MDS plots as well as to perform differential expression analysis between contrasts and generation of the overlap by Venn diagram. To create a succinct list of genes that could best classify the central region against the IF, we adopted a machine-learning method, pamr. Groups were stratified randomly into a three quarter training set and one quarter test set. We used genefilter's “varFilter” method to reduce the complexity of the features, which we also repeated for the pamr process at increasing stringencies to increase confidence in the list generated. We performed pamr analysis using a 10-fold cross-validation and chose our threshold to select the lowest misclassification rate (t = 2.0, misclassification = 5/36, and an overall error rate = 0.138). Using our initial classification run, pamr proffered a list of 58 features equating to 30 annotated genes. This annotated gene list formed the benchmark for dataset stratification in other independent datasets for the rest of this study. Hierarchical clustering performed in R was done using heatmap.plus using the Ward clustering method with Euclidean distance and with ordination of the data performed using correspondence analysis with the package made4 and visualized using the plotarrays parameter with differing graph arguments.
Independent datasets
Affymetrix gene expression profiles from independent colorectal cancer datasets were downloaded from NCBI Gene Expression Omnibus (http://www.ncbi.nlm.nih.gov/geo/) under accession numbers GSE14333, GSE35602, GSE33113, GSE39396, and GSE39582. In addition, the independent mouse dataset was accessed under GSE6383. Partek Genomics Suite was used on these series matrix files for independent dataset analysis. For the purpose of clustering, the data matrices were standardized to the median value of probe sets expression. Standardization of the data allows for the comparison of expression levels for different probe sets, which may not necessarily be on the same scale or at the same intensity levels. Following standardization, 2-dimensional hierarchical clustering was performed using the Ward clustering method with Euclidean distance.
Statistical analysis
Positive prediction value (PPV) was calculated as PPV = number of true positives/number of positive calls. Negative prediction value (NPV) was calculated as NPV = number of true negatives/number of negative calls. Sensitivity = number of true positives/number of true positives + number of false negatives. Specificity = number of true negatives/number of true negatives + number of false positives.
Results
Identification of region-specific transcriptomic profiles
To assess tumor heterogeneity at the level of transcription, we performed gene expression profiling on a cohort of patients (n = 25; Supplementary Table S1) using tumor samples taken from multiple regions of the primary tumor, in addition to tumor tissue, which had metastasized to regional LNs (Supplementary Fig. S1). The resulting transcriptomic data were analyzed using limma to identify differentially expressed genes. A supervised learning approach, pamr, was employed to extract a succinct list of genes that could highlight the contrasts between samples from different regions, which could then be visualized using a combination of a heatmap and hierarchical clustering.
Determination of the number of genes that were differentially expressed (DE) between each region indicated that the transcriptome of the central tumor (CT) was more closely related to that of the IF than to that of the LN tumor tissue (Fig. 1A; Supplementary Tables S2–S4). However, both limma and pamr analyses revealed distinct differences between gene expression in the CT and IF, with a consistent upregulation of known drivers of disease progression, such as IGF1 (2.3- to 5-fold) and SFRP2 (2.6- to 4-fold) at the IF region, whereas upregulation of CXCL5 (3.3- to 8-fold), IL8 (3.6- to 4.4-fold), and MMP1 (2.6- to 7.9-fold) were consistently found in the CT region (Fig. 1B; Supplementary Table S2).
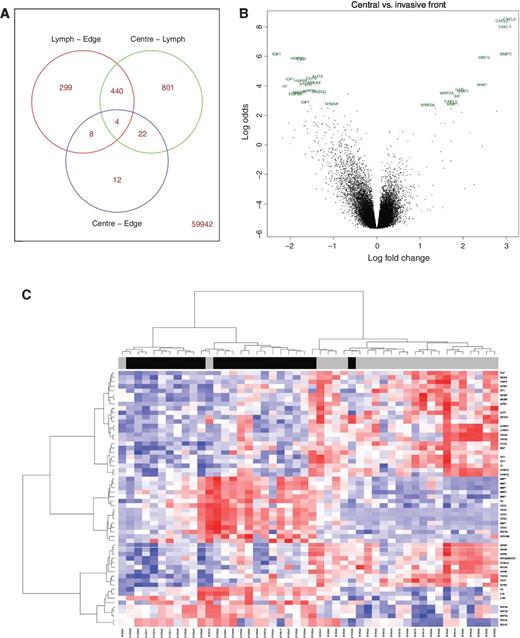
Differential analysis and classifier generation. A, Venn diagram, produced using limma, of numbers of probe sets, which are differentially expressed between each region. The total number of DE genes increases as spatial distance from the CT increases. Right, bottom, the number of probes that do not appear in any of the three Venn sets is displayed. This indicates that there are very small but robust differences in the transcriptome of the CT compared with the IF. B, volcano plot depicting highest ranked DE genes between the central and IF regions. Gene symbols corresponding to each individual probe set identified are depicted. C, heatmap of central and IF samples clustered by expression values of the 30 genes in the supervised invasive classifier. Overlay bar depicts the region from which the sample originated, with black representing the CT and gray representing IF samples, confirming the robustness of the 30 genes used in classifying samples based on region-of-origin.
Differential analysis and classifier generation. A, Venn diagram, produced using limma, of numbers of probe sets, which are differentially expressed between each region. The total number of DE genes increases as spatial distance from the CT increases. Right, bottom, the number of probes that do not appear in any of the three Venn sets is displayed. This indicates that there are very small but robust differences in the transcriptome of the CT compared with the IF. B, volcano plot depicting highest ranked DE genes between the central and IF regions. Gene symbols corresponding to each individual probe set identified are depicted. C, heatmap of central and IF samples clustered by expression values of the 30 genes in the supervised invasive classifier. Overlay bar depicts the region from which the sample originated, with black representing the CT and gray representing IF samples, confirming the robustness of the 30 genes used in classifying samples based on region-of-origin.
Using pamr classification, we extracted a concise gene list, comprising 30 annotated genes, that could identify and characterize the transcriptome associated with a minimum overall error (error rate = 0.138; Table 1). As expected, this gene list contained a number of genes already reported to be involved in cancer progression, many of which were also represented in the DE gene list (Supplementary Table S2), such as IGF1, TGFB3, IL8, IL1B, and WNT5A. We validated the gene list by applying it to the full cohort of IF and CT samples (Fig. 1C) using hierarchical clustering to visualize ranges of expression. The region-of-origin was correctly identified in 44 of 48 samples, giving this classifier a PPV for membership of IF = 91.7% and a corresponding NPV for membership of CT = 91.7%.
30-gene classifier of tumor region
| Symbol | Entrez gene name |
|---|---|
| ABCA9 | ATP-binding cassette, sub-family A (ABC1), member 9 |
| ABI3BP | ABI family, member 3 (NESH) binding protein |
| C7 | Complement component 7 |
| CASQ2 | Calsequestrin 2 (cardiac muscle) |
| CILP | Cartilage intermediate layer protein |
| CILP2 | Cartilage intermediate layer protein 2 |
| FABP4 | Fatty acid binding protein 4, adipocyte |
| HSPB6 | Heat shock protein, alpha-crystallin-related, B6 |
| IGF1 | Insulin-like growth factor 1 (somatomedin C) |
| LONRF2 | LON peptidase N-terminal domain and ring finger 2 |
| MGP | Matrix Gla protein |
| MYOM1 | Myomesin 1 |
| PTGIS | Prostaglandin I2 (prostacyclin) synthase |
| SFRP1 | Secreted frizzled-related protein 1 |
| SFRP2 | Secreted frizzled-related protein 2 |
| SLIT3 | Slit homolog 3 |
| SYNPO2 | Synaptopodin 2 |
| TGFB3 | Transforming growth factor, beta 3 |
| WT1 | Wilms tumor 1 |
| ZBTB16 | Zinc finger and BTB domain containing 16 |
| CXCL1 | Chemokine (C-X-C motif) ligand 1 |
| CXCL5 | Chemokine (C-X-C motif) ligand 5 |
| CXCL8 | Chemokine (C-X-C motif) ligand 8 |
| HCAR3 | Hydroxycarboxylic acid receptor 3 |
| IL1B | Interleukin 1, beta |
| MMP1 | Matrix metallopeptidase 1 |
| MMP3 | Matrix metallopeptidase 3 |
| REG1A | Regenerating islet-derived 1 alpha |
| WNT5A | Wingless-type MMTV integration site family, member 5A |
| LCN1 | Lipocalin 1 |
NOTE: Top 30 ranked genes across returned from our supervised analysis giving the lowest misclassification rate, which can identify the region-of-origin when using multiple samples from the primary tumor with a PPV and NPV of 91.7%. The top 20 genes (top panel) are overexpressed in the invasive front samples compared with the CT, whereas the bottom 10 genes (bottom panel) are overexpressed in the CT samples compared with the invasive front. This machine learning–derived 30-gene classifier can identify tumor tissue based on region-of-sampling as shown in Fig. 1C.
Specific gene signatures identify tissue regions of origin
To test the ability of stromal gene expression to classify tumor samples, we utilized a list of 213 genes, which are specifically expressed in cancer-associated fibroblasts (n = 131), leukocytes (n = 47), or endothelial cells (n = 35; ref. 11). Using this gene list, the samples from LN, CT, and IF could be separated into 3 biologic groups corresponding to their site of origin, using correspondence analysis of the top quartile most variant probes (Fig. 2). Whereas Isella and colleagues (11) and Calon and colleagues (12) have shown that these 213 nonepithelial genes can be used to identify poor prognostic patients, we now demonstrate that the same genes can be used to identify the site of the tumor from which the sample has been taken. Moreover, the 30-gene list (which we now define as a stromal classifier) was also able to correctly distinguish between tumor and stroma tissues in a cohort of 13 colorectal cancer tumor samples (GSE35620), each of which was microdissected into these two components, with no misclassification (Fig. 3A and B). As a further validation, we used a tissue-specific dataset (GSE6383), which identified genes expressed in the mesenchymal and epithelial compartments of the perinatal mouse intestine (13). This analysis revealed that the genes that we found to be overexpressed in IF compared with CT are highly expressed in the stromal mesenchyme fraction of the developing mouse intestine compared with the epithelium and can stratify samples into regions of origin with no misclassification (Fig. 3C). Collectively, these findings indicate that our 30-gene stromal classifier is an accurate identifier of tissue origin.

Ordination of samples by region-of-origin based on previously published stromal-specific gene signature. Correspondence analysis depicting a strong separation and grouping of the CT, IF, and LN samples according to their region-of-origin using the most variant probes from the Isella and colleagues 213 stromal-specific gene signature following cross annotation (top quartile). Left, projection of individual samples; right, grouping with ellipse and star arguments. These findings highlight the role of the nontumoral transcriptome on the intratumoral heterogeneity of primary colorectal cancer tumor tissue analysis.
Ordination of samples by region-of-origin based on previously published stromal-specific gene signature. Correspondence analysis depicting a strong separation and grouping of the CT, IF, and LN samples according to their region-of-origin using the most variant probes from the Isella and colleagues 213 stromal-specific gene signature following cross annotation (top quartile). Left, projection of individual samples; right, grouping with ellipse and star arguments. These findings highlight the role of the nontumoral transcriptome on the intratumoral heterogeneity of primary colorectal cancer tumor tissue analysis.

Stromal-derived gene transcripts underpin sample classification according to region-of-origin. A, heatmap based on expression values of the genes from our supervised stromal classifier, which are highly expressed at the IF, can stratify samples according to tissue type in GSE35620, which contains transcriptional profiles of microdissected primary colorectal cancer tumors purified into epithelial and stromal compartments. B, PCA plot from sample distribution based on clustering in A, again validating the utility of our classifier in identifying tissue type. PCA, principal component analysis. C, heatmap based on expression values of genes from the stromal classifier, which are highly expressed at the IF, using transcriptional profiles from GSE6383, which contains mouse intestinal tissue separated into epithelial and mesenchymal compartments. These findings highlight the stromal-specific source of the gene transcripts identified in our classifier. Hierarchical.
Stromal-derived gene transcripts underpin sample classification according to region-of-origin. A, heatmap based on expression values of the genes from our supervised stromal classifier, which are highly expressed at the IF, can stratify samples according to tissue type in GSE35620, which contains transcriptional profiles of microdissected primary colorectal cancer tumors purified into epithelial and stromal compartments. B, PCA plot from sample distribution based on clustering in A, again validating the utility of our classifier in identifying tissue type. PCA, principal component analysis. C, heatmap based on expression values of genes from the stromal classifier, which are highly expressed at the IF, using transcriptional profiles from GSE6383, which contains mouse intestinal tissue separated into epithelial and mesenchymal compartments. These findings highlight the stromal-specific source of the gene transcripts identified in our classifier. Hierarchical.
To further delineate the source of the identified transcriptional signals to a precise cell-of-origin, we utilized microarray profiles derived from primary colorectal cancer tumors that have undergone disassociation and sorting to isolate cells into epithelial, endothelial, fibroblast, and leukocytes compartments (GSE39396). Hierarchical clustering of our classifier using these cell-sorted profiles indicated the upregulation of each transcript signal specifically in the fibroblast component, compared with the remaining tumor cell types (Fig. 4A). Following median normalization for each individual gene across all four cell types, we again confirmed that the upregulation of the transcription levels for our classifier occurs specifically within the fibroblasts, compared with all other cell types (Fig. 4B).

Specific cell of origin of transcriptional classifier. A, heatmap expression values of stromal classifier in GSE39396 of FACS-selected cells into specific endothelial (CD45+, EPCAM−, CD31−, FAP−), epithelial (CD45− EPCAM+, CD31−, FAP−), leukocyte (CD45−, EPCAM−, CD31+, FAP−), and fibroblast (CD45−, EPCAM−, CD31−, FAP+) populations, which suggests upregulation of these transcripts in the cancer-associated fibroblast compartments compared with the other compartments of the tumor microenvironment. B, these findings were confirmed by median normalizing and plotting each gene using dot-plots according to specific cell type. Median value for overall gene expression in each cell type is indicated. Error bars, SD.
Specific cell of origin of transcriptional classifier. A, heatmap expression values of stromal classifier in GSE39396 of FACS-selected cells into specific endothelial (CD45+, EPCAM−, CD31−, FAP−), epithelial (CD45− EPCAM+, CD31−, FAP−), leukocyte (CD45−, EPCAM−, CD31+, FAP−), and fibroblast (CD45−, EPCAM−, CD31−, FAP+) populations, which suggests upregulation of these transcripts in the cancer-associated fibroblast compartments compared with the other compartments of the tumor microenvironment. B, these findings were confirmed by median normalizing and plotting each gene using dot-plots according to specific cell type. Median value for overall gene expression in each cell type is indicated. Error bars, SD.
The 30-gene Stromal Classifier overlaps with the CMS4 subtype
We next interrogated an independent stage II/III colon cancer dataset (2). Using a semisupervised clustering approach, we identified a subset of tumors accounting for 20% of the overall cohort that were positive for the 30-gene Stromal Classifier. Of these tumors, almost 90% are associated with the previously reported stem-like (CMS4) poor prognostic group (Fig. 5A; ref. 2). These findings show that the genes that are differentially expressed between the central and IF regions of a primary tumor can identify patients exhibiting a poor prognostic “stem cell-like” mesenchymal biology. In addition, in two further independent datasets GSE14333 [a mixed stage II/III dataset (14)] and GSE33113 [an untreated stage II dataset (7)], the 30-gene Stromal Classifier consistently identified patients with a poorer prognosis, although these associations just failed to reach significance, most likely due to limited sample numbers (Fig. 5B).

Prognostic value and patient stratification using transcriptional profiling is based on stromal-derived genes. A, identification of an invasive-like cluster, accounting for 20% of the patient cohort, using our supervised stromal classifier and expression data from a large well-characterized stage II/III colorectal cancer dataset; GSE39582. This cluster strongly identifies the previously characterized stem-like C4 (CMS4) poor prognostic group with a sensitivity of 89% and specificity of 87%. B, Euclidean clustering and survival analysis using our stromal classifier in GSE14333 (top) and GSE33113 (bottom). The stromal classifier isolates a subgroup of patients accounting for between 21% to 26% of each cohort, with a trend toward a worse prognosis compared with remaining patients (HR = 1.942 in GSE14333 and HR = 2.914 in AMC-AJCCII-90). C, heatmap depicting Euclidean clustering of central and IF samples using previously reported stem-like patient classifier (stem-like C4 classifier from ref. 2). This poor prognostic classifier defines two distinct groups, based on clustering distance, which are highly stratified based on region-of-sampling using the most variant probes (top quartile).
Prognostic value and patient stratification using transcriptional profiling is based on stromal-derived genes. A, identification of an invasive-like cluster, accounting for 20% of the patient cohort, using our supervised stromal classifier and expression data from a large well-characterized stage II/III colorectal cancer dataset; GSE39582. This cluster strongly identifies the previously characterized stem-like C4 (CMS4) poor prognostic group with a sensitivity of 89% and specificity of 87%. B, Euclidean clustering and survival analysis using our stromal classifier in GSE14333 (top) and GSE33113 (bottom). The stromal classifier isolates a subgroup of patients accounting for between 21% to 26% of each cohort, with a trend toward a worse prognosis compared with remaining patients (HR = 1.942 in GSE14333 and HR = 2.914 in AMC-AJCCII-90). C, heatmap depicting Euclidean clustering of central and IF samples using previously reported stem-like patient classifier (stem-like C4 classifier from ref. 2). This poor prognostic classifier defines two distinct groups, based on clustering distance, which are highly stratified based on region-of-sampling using the most variant probes (top quartile).
To assess the extent that patient classification can be dictated by the tumor region sampled, we performed a reciprocal in silico analysis, in which the 48 samples representing IF and CT were classified using the genes previously published to classify the stem-like mesenchymal subtype (2). This analysis revealed 2 separate clusters, both highly enriched for samples based on the region-of-origin, with 75% of profiles originating from the IF being classified as stem cell-like (Fig. 5C), compared with 33% for CT.
Discussion
Region-specific transcriptional profiling allows precise dissection of the role of different tissue compartments in colorectal cancer disease biology, while also providing prognostic information on individual patients. Our results from two independent datasets GSE35620 (Fig. 3A and B) and GSE6383 (Fig. 3C) are in line with the recent stromal studies reported (11, 12) and further confirm that the key genes involved in classification of patient samples are derived from a stromal origin. These data collectively challenge the general assumption that tumors classified as mesenchymal, or in the CMS4 subgroup, have undergone widespread EMT, resulting in lower levels of epithelial-associated traits in the tumor cell compartment, when actually these tumors have a higher component of stromal (particularly fibroblast) infiltration. Although IHC-based analysis of colorectal cancer tumors has shown that neoplastic epithelial cells expressing stem-like properties have a poor prognosis (15–17), our findings emphasize that the CMS4 subgroup represents tumors with higher transcription levels of mesenchymal-associated genes, which can be attributed to their overall stromal-rich, and in particular fibroblast, architecture.
Although our data strongly suggest that the overall proportion of EMT in CMS4 tumors is not as extensive as first proposed, we did observe some evidence of localized loss of E-cadherin staining in a small proportion of budding cells (data not shown). Precise examination of these individual tumor buds may reveal the biology driving the invasive nature of individual cells compared with the overall tumor mass. Stromal–epithelial interactions have a clear underlying role in the development of tissue and in the shaping of the microenvironment in both normal and malignant conditions. The configuration of the tumor border region itself can also give insight into the prognosis of a patient, with a high degree of stromal infiltration into a tumor being a poor prognostic indicator (18, 19).
Although the finding that high levels of stromal infiltration are associated with poor prognosis is not new (11, 12, 18, 19), this study precisely delineates the cell-of-origin to the fibroblast compartment, with primary results validated in a comprehensive series of online datasets. Data presented here, in addition to these referenced studies (12, 18–20), highlight that expression of a small number of genes in fibroblasts associated with the tumor, in combination with the overall fibroblast content, is sufficient to identify poor prognostic patients in stage II colorectal cancer. It is unsurprising therefore that the prognostic value of the CMS4 subtype, and indeed other current transcriptional-based prognostic classifiers, is highly dependent on stromal-derived gene signatures and that our 30-gene Stromal Classifier also identifies a group of patients with a worse prognosis. A combined classification system, utilizing clinical, morphologic, and molecular features, has been previously proposed and shown to provide a confident prediction of patient outcome (21). Multiregion sequencing and mutational analysis has highlighted diversity in renal (22) and recently in colorectal cancer (23) patient samples, but our data show that patient classification in colorectal cancer utilizing transcriptional profiling is associated as much with the region from where the sample is derived from, as with the underlying tumor biology.
Implications of transcriptomic heterogeneity within colorectal cancer
Data presented here show for the first time that the recently published colorectal cancer CMS classification system (9) is dependent not just on the overall driving biology of a tumor, but also on the region of sampling. We have shown that each individual primary tumor has the potential to be classified into a poor prognostic mesenchymal subtype if the tissue employed in the analysis is taken from the IF of the tumor, regardless of the inherent CMS subtype of the tumor overall. These findings may have important implications for the use of molecular classification approaches in selecting patients for therapeutic intervention in biomarker-driven stratified clinical trials. Given the lack of standardized procedures employed in tissue sampling for these transcriptional profiling approaches, our data provide cautionary evidence that a generic transcriptional profiling strategy, which does not consider the role of specific site of tissue origin within the tumor, could result in patient misclassification into inappropriate subgroups, leading to inaccurate prognostication and treatment that yields no benefit or may even potentially harm patients.
A recent precision medicine–based clinical trial, the WINTHER study (an output of the Worldwide Innovative Networking in personalized cancer medicine Consortium; refs. 24, 25), aimed at selecting optimal innovative drug treatment strategies for patients with advanced metastatic tumors, has highlighted the utility of sampling matched normal and tumor biopsies from the same patient to identify novel therapeutic strategies based on differential gene expression in the neoplastic tissue compared with the normal sample. There are a number of clear similarities between the WINTHER study approach and the findings presented here, where the nontumor component can inform prognosis, but although there seems to be clear rationale for this approach aimed at personalized drug selection, there may be only limited benefit derived by subtracting the results of adjacent normal or stromal tissue to correctly classify the overall tumor molecular subtype. As the defined CMS of colorectal cancer are based on the presence and extent of infiltrating stroma, the subtraction of nontumor cell signaling would likely result in further misclassification, similar to what Isella and colleagues (11) reported following molecular subtyping of PDX-implanted colorectal cancer tumor tissue. Furthermore, our data and those of Isella and colleagues (11) and Calon and colleagues (12) also raise the important question as to which aspect of this stromal–tumor interface dictates aggressive tumor biology, and in turn, response to therapy.
The primary tumor samples used in this study are predominantly from patients with nonmetastatic disease (92% stage II/III; Supplementary Table S1) and as such represent samples with limited molecular heterogeneity compared with pretreated metastatic solid tumor samples or samples from advanced leukemia patients [e.g., blast crisis chronic myeloid leukemia (CML)], both of which can introduce further complicating issues when assessing prognosis and treatment response using molecular-based precision medicine approaches (26). Although there is, as yet, no defined metastatic-specific CMS typing approach that captures transcriptional changes associated with liver and lung tissue infiltration, there will inevitably be variations in the stromal content of metastatic lesions in both the liver and lung similar to what we have presented here in the primary setting. The prognosis of tumors with high metastatic site-specific stromal infiltration may not equate to that of high levels of fibroblast infiltration in primary colorectal cancer tumors, and in a similar scenario to blast crisis CML, it is clear that putative treatment regimes for molecularly heterogeneous metastatic neoplastic lesions from solid tumors require very careful consideration to achieve therapeutic success (26).
In conclusion, the data we have presented here, alongside other recent publications (11, 12), question the contribution of tumor epithelial cells to colorectal cancer gene expression signatures and emphasize the need to value the role of stromal-derived signatures in modulating colorectal cancer biology. Furthermore, they also provoke a cautionary reevaluation of the thesis of several recent publications [including the CRCSC CMS article (9); refs. 2–4] that molecular classification, irrespective of tumor tissue site of origin, can be reliably employed to underpin treatment algorithms in colorectal cancer. We propose that a morpho-molecular strategy (27), integrating tissue morphology/origin, molecular evaluation (e.g., gene expression profiling, next-generation sequencing, tissue microarray analyses), and clinical phenotype in a common integromics framework (28), is necessary for precise, robust and clinically relevant dissection of tumor biology that will inform the next generation of investigator-led biomarker-driven interventional trials in this common disease.
Disclosure of Potential Conflicts of Interest
P.W. Hamilton is an employee of, holds ownership interest (including patents) in, and is a consultant/advisory board member for PathXL Ltd. P.G. Johnston holds ownership interest (including patents) in Almac Diagnostics, CV6 Therapeutics, and Fusion Antibodies, reports receiving speakers bureau honoraria from, and is a consultant/advisory board member for Chugai and Pfizer. No potential conflicts of interest were disclosed by the other authors.
Authors' Contributions
Conception and design: P.D. Dunne, D.G. McArt, C.A. Bradley, P.W. Hamilton, D.B. Longley, E.W. Kay, P.G. Johnston, M. Lawler, M. Salto-Tellez, S.V. Schaeybroeck
Development of methodology: P.D. Dunne, D.G. McArt, R. Cummins, P.W. Hamilton, E.W. Kay, P.G. Johnston, M. Lawler, S.V. Schaeybroeck
Acquisition of data (provided animals, acquired and managed patients, provided facilities, etc.): P.D. Dunne, H.L. Barrett, R. Cummins, T. O'Grady, E.W. Kay, P.G. Johnston, S.V. Schaeybroeck
Analysis and interpretation of data (e.g., statistical analysis, biostatistics, computational analysis): P.D. Dunne, D.G. McArt, P.G. O'Reilly, T. O'Grady, S.S. McDade, P.W. Hamilton, E.W. Kay, P.G. Johnston, M. Lawler, M. Salto-Tellez, S.V. Schaeybroeck
Writing, review, and/or revision of the manuscript: P.D. Dunne, D.G. McArt, C.A. Bradley, P.G. O'Reilly, R. Cummins, T. O'Grady, K. Arthur, M.B. Loughrey, W.L. Allen, S.S. McDade, D.J Waugh, P.W. Hamilton, D.B. Longley, E.W. Kay, P.G. Johnston, M. Lawler, M. Salto-Tellez, S.V. Schaeybroeck
Administrative, technical, or material support (i.e., reporting or organizing data, constructing databases): P.D. Dunne, T. O'Grady, K. Arthur, P.G. Johnston, S.V. Schaeybroeck
Study supervision: P.D. Dunne, P.G. Johnston, M. Lawler, S.V. Schaeybroeck
Grant Support
This work was supported by a Cancer Research UK (CRUK) Programme grant and a joint Medical Research Council UK (MRC) and CRUK Programme grant (S:CORT).
The costs of publication of this article were defrayed in part by the payment of page charges. This article must therefore be hereby marked advertisement in accordance with 18 U.S.C. Section 1734 solely to indicate this fact.