


Abstract
Purpose: The pathways underlying basal-like breast cancer are poorly understood, and as yet, there is no approved targeted therapy for this disease. We investigated the role of mitogen-activated protein kinase kinase (MEK) and phosphatidylinositol 3-kinase (PI3K) inhibitors as targeted therapies for basal-like breast cancer.
Experimental Design: We used pharmacogenomic analysis of a large panel of breast cancer cell lines with detailed accompanying molecular information to identify molecular predictors of response to a potent and selective inhibitor of MEK and also to define molecular mechanisms underlying combined MEK and PI3K targeting in basal-like breast cancer. Hypotheses were confirmed by testing in multiple tumor xenograft models.
Results: We found that basal-like breast cancer models have an activated RAS-like transcriptional program and show greater sensitivity to a selective inhibitor of MEK compared with models representative of other breast cancer subtypes. We also showed that loss of PTEN is a negative predictor of response to MEK inhibition, that treatment with a selective MEK inhibitor caused up-regulation of PI3K pathway signaling, and that dual blockade of both PI3K and MEK/extracellular signal–regulated kinase signaling synergized to potently impair the growth of basal-like breast cancer models in vitro and in vivo.
Conclusions: Our studies suggest that single-agent MEK inhibition is a promising therapeutic modality for basal-like breast cancers with intact PTEN, and also provide a basis for rational combination of MEK and PI3K inhibitors in basal-like cancers with both intact and deleted PTEN.
We find that basal-like breast cancer models are sensitive in vitro and in vivo to the inhibitory effects of mitogen-activated protein kinase kinase (MEK) inhibition relative to luminal and HER2-amplified tumors and identify the tumor suppressor PTEN as a negative predictor factor for response to MEK inhibition. We also find that a combination of MEK and phosphatidylinositol 3-kinase inhibitors results in enhanced efficacy in both PTEN wild-type and PTEN-null basal-like tumors and provide a mechanistic explanation for this observation. Thus, our studies provide a rational hypothesis for biomarker evaluation and patient stratification in clinical trials seeking to evaluate the efficacy of MEK and phosphatidylinositol 3-kinase inhibitor treatment in this poor-prognosis tumor type.
Recent molecular profiling studies have suggested that breast cancers represent at least three distinct diseases with a common tissue of origin but different underlying biological aberrations. Gene expression studies have shown that primary breast tumors may be classified into at least three major subtypes by unsupervised hierarchical clustering analysis and that the subtypes have different prognostic outcomes in terms of patient survival (1). Luminal breast cancers are typically estrogen receptor (ER) positive and characterized by coordinate expression of a number of epithelial specific genes, a relatively good prognosis, and good response rates to targeted hormonal therapies (2). HER2-positive breast cancers are characterized by high-level gene amplification of the HER2 oncogene, relatively poor prognosis if untreated, and significant clinical benefit from the HER2 targeting monoclonal antibody trastuzumab (Herceptin, Genentech; ref. 3). Basal-like breast cancers typically lack expression of HER2, ER, and progesterone receptor and hence overlap with tumors immunohistochemically defined as “triple-negative” tumors (4). Basal-like breast cancers have a poor prognosis and currently have not been shown to respond to any targeted therapy and thus represent a particularly pressing unmet medical need (5). Interestingly, the majority of basal-like breast cancers express high levels of the epidermal growth factor receptor (EGFR) and have an EGFR-associated gene expression signature (6). Because growth factor stimulation of EGFR results in potent activation of the signaling pathway composed of RAS, RAF, mitogen-activated protein kinase (MAPK) kinase (MEK), and extracellular signal–regulated kinase (ERK; ref. 7), we sought to determine whether the downstream arm of this pathway might be a target of therapeutic intervention in breast cancer.
The protein kinase MEK occupies a crucial signaling node downstream of RAS and RAF and directly upstream of ERK and as such has been the subject of intensive drug discovery activities (8). Genetic and biochemical analyses of MEK function have suggested that MEK activity is necessary for the transforming and proliferative effects of this pathway, suggesting that therapeutics that completely inhibit MEK function may have utility in the treatment of cancers driven by activation of the RAS/RAF axis. Such efforts have led to the development of molecules such as PD0325901 and AZD6244 that act through a novel noncompetitive allosteric mechanism of inhibition by binding to a site adjacent to the ATP-binding site and locking the kinase in a closed and catalytically inactive conformation (9). This pathway is frequently activated by mutations in RAS family members or BRAF in a number of solid tumor types, and elegant studies in cell lines and mouse tumor models have suggested that mutations in BRAF and, to a lesser extent, KRAS may be useful to stratify patients enrolled in clinical trials of MEK inhibitors (10). We sought to address whether MEK inhibition might have therapeutic value in breast cancer through evaluation of a large panel of breast cancer cell lines and tumor xenograft models that have been characterized in detail at the molecular level and shown to reflect many of the genomic alterations commonly found in breast tumors (11).
We also set out to examine the relationship between RAS/RAF/MEK/ERK pathway activity and phosphatidylinositol 3-kinase (PI3K) pathway activity in breast cancer. PI3K signals through Akt and other downstream effectors and represents a key mechanism of transducing proliferative and antiapoptotic signals (12), and this pathway is activated to some extent in all three breast cancer subtypes. Activating mutations in the catalytic subunit of p110-α (PIK3CA) occur in 25% to 30% of breast tumors and are associated with hormone receptor positive (i.e., luminal subtype) status (13), and it has recently been shown that loss of the tumor suppressor gene PTEN is common in basal-like tumors (14). Finally, the HER2 oncogene signals through the PI3K pathway, and Herceptin has been shown to down-regulate antiapoptotic signaling mediated by this pathway (15). Given the role of both the RAS and PI3K pathways in cancer signaling, a crucial question is whether these pathways are activated concomitantly in breast tumors and how activation of one pathway can affect the response to therapeutics that target the other.
A central finding of this study is that basal-like breast cancer cell lines and tumor models manifest an oncogenic Ras-like gene expression signature and are substantially more sensitive in vitro and in vivo to MEK inhibition than luminal or HER2-amplified models, suggesting that MEK inhibition represents a promising therapeutic modality for this aggressive tumor type with currently limited treatment options. A recent independent study showed a role for MEK inhibition in basal-like breast cancer based on in vitro analyses (16). Our studies are consistent with those findings and, moreover, offer extensive in vivo confirmation of the important role MEK signaling plays in basal-like breast cancer. In addition, we also show that activation of the PI3K/Akt pathway by loss of the tumor suppressor PTEN occurs in a subset of basal-like breast cancer cell line models and is associated with diminished response to MEK inhibition, and that siRNA ablation of PTEN in responsive models blocks cell cycle and proliferative changes triggered by MEK inhibition. Based on the apparent role of PTEN and activation of the PI3K/Akt pathway in mediating resistance to MEK inhibition, we use both in vitro and in vivo combination studies with potent and selective MEK and PI3K inhibitors to show that simultaneous treatment with a MEK inhibitor and a potent and selective inhibitor of PI3K results in synergistic decreases in cell viability, enhanced down-regulation of cyclin D1, and increased apoptosis specifically in basal-like breast cancer models.
Materials and Methods
Cell lines and cell viability experiments. Details and sources of all cell lines used in this study have been described previously (11, 17) and are also detailed in Supplementary Materials and Methods. All studies in this report describing MEK inhibition have used the potent and selective MEK1/2 inhibitor PD0325901 (Pfizer) to evaluate the effects of MEK inhibition in breast cancer preclinical models, with the exception of a small number of confirmatory studies described in Supplementary materials that use a second potent and selective MEK inhibitor (9), purchased from Synthesis MedChem.5
For cell viability studies, cells were plated in quadruplicate at a density of 3,000 per well in 384-well plates in normal growth medium and allowed to adhere overnight. Compounds were added in 10 concentrations based on a 3-fold dilution series. Cell viability was measured 72 h later using the CellTiter-Glo Luminescent Cell Viability Assay (Promega). The concentration of drug resulting in 50% of maximal inhibition (EC50) was calculated from a four-parameter curve analysis (XLfit, IDBS software) and was determined from a minimum of three experiments. For cell lines where minimal inhibition was observed and the software was unable to calculate an EC50, the value was nominally assigned as the highest concentration screened (20 μmol/L) and these cell lines were classified as resistant. Caspase-3/caspase-7 activity was assessed by plating 5,000 cells per well in quadruplicate in 384-well plates and incubation in the presence of DMSO, 1 μmol/L MEK inhibitor, 1 μmol/L PI3K inhibitor, or a combination of MEK and PI3K inhibitors each at 1 μmol/L. Activation of caspase-3/caspase-7 was assessed 24 h later by the Caspase-Glo 3/7 assay kit (Promega).High-content analysis of cell proliferation. High-content screening assays were carried out on an Arrayscan VTI (Cellomics, Inc.) using standard bromodeoxyuridine incorporation and staining protocols, as described in Supplementary Experimental Procedures.
In vitro combination experiments.In vitro synergy was assessed using the combination index of Chou and Talalay method using CalcuSyn software.6
Generally, combination index values of <0.5 are taken to indicate synergistic interaction between compounds, and combination index values near 1.0 indicate no interaction (18). Additional details are provided in Supplementary Experimental Procedures.Three-dimensional cell culture. For three-dimensional cultures, BT474M1 and MDA-MB-231 cells were trypsinized from monolayer cultures and plated on top of commercially available laminin-rich matrix produced from Englebreth-Holm-Swarm tumors (Matrigel, BD Biosciences) using a previously described protocol (19). Cell lines were maintained in modified DMEM and 10% fetal bovine serum conditioned with 5% Matrigel. Cells were treated in triplicate with 0.25 μmol/L GDC-0941, 0.5 or 1 μmol/L PD0325901, or a combination of the two agents on day 0. Culture medium was refreshed every 3 d, and acinar growth and morphogenesis were analyzed on day 10. Cell number was assayed on day 7 (MDA-MB-231) or day 10 (BT474) using CellTiter-Glo (Promega) according to the manufacturer's instructions. Data are representative of three independent experiments.
Protein analyses. For in vitro pharmacodynamic studies, BT474, HDQ-P1, CAL85-1, and MDA-MB-231 cells were plated in 12-well plates and allowed to grow until cells reached 60% to 80% confluence. Cells were dosed with 0, 0.1, or 1.0 μmol/L MEK inhibitor and duplicate plates were made for each time point. Cells were incubated in the compound for 6 or 24 h, then washed with cold PBS and processed for Western blotting using standard protocols, as described in Supplementary Experimental Methods. CAL85-1 cells were cultured in medium containing 10 ng/mL EGF to assess phospho-Akt (pAkt) levels because basal levels of pAkt are undetectable in this cell line when cultured in 10% fetal bovine serum. For analysis of protein expression in tumor xenografts, lysate from tumor samples was collected by adding DNase Lysis Buffer to frozen tissue and pulverized using the TissueLyser (Qiagen) as described by the manufacturer. Primary blotting antibodies used were p27 (C-19; Santa Cruz Biotechnology), cyclin D1 (DCS-6; Santa Cruz Biotechnology), ERK, pERK (Thr202/Tyr204) (Cell Signaling Technology), total AKT, and pAkt (S473) (Cell Signaling Technology). Secondary blotting antibodies used were polyclonal goat anti-mouse IgG horseradish peroxidase and polyclonal goat anti-rabbit IgG horseradish peroxidase (both from DAKO or Cell Signaling Technology). Quantitation of Western blot bands was accomplished using Image J software (NIH) and band intensities were normalized to β-actin or total ERK. Quantitative analysis of protein expression using reverse-phase protein arrays was done at Theranostics Health (Rockville, MD) as described previously (20) and in Supplementary Materials and Methods.
siRNA experiments. Individual siRNA duplexes specific to human PTEN or EGFR (Dharmacon) or a control siRNA that does not target any sequence in the human genome (nontarget control; Dharmacon) was used in transient transfection experiments. Transfection conditions are described in detail in Supplementary Materials and Methods.
In vivo studies. For in vivo studies at Oncotest, tumor fragments obtained from MAXF-401 and MAXF-1384 xenografts in serial passage were cut into 1- to 2-mm3 pieces and placed in RPMI 1640 until s.c. implantation into NMRI nu/nu mice (Taconic). When tumors reached an average of 100 mm3, animals were stratified into two equivalent groups of 10 tumor-bearing mice each. MX-1 tumors were maintained by serial s.c. transplantation of 1-mm3 fragments in nu/nu mice (Harlan). For efficacy studies, mice with tumors of a mean volume of 200 to 250 mm3 were grouped into treatment cohorts of 10 mice each. For BT474M1 tumor xenografts, beige nude Xid mice (Harlan) were injected in the right flank with 5 × 10⁶ human BT474M1 cells resuspended in 200 μL PBS and Matrigel (BD Biosciences). Mice with tumors of a mean volume of 200 to 250 mm3 were grouped into treatment cohorts. MEK inhibitor was administered daily by oral gavage at a final concentration of 2.5 to 25 mg/kg, as indicated. The compound was prepared fresh weekly in 0.5% methylcellulose and 0.2% Tween 80 in water and stored at 4°C. Body weights and caliper measurements were taken twice per week during the study. Tumor volumes were calculated by the following formula: tumor volume = 0.5 × (a × b2), where a is the largest tumor diameter and b is the perpendicular tumor diameter. Tumor volume results are presented as mean tumor volume ± SE and data were analyzed by Student's t test and Hsu's MCB. Tumor samples from additional cohorts of mice were collected for analysis of pathway activation following 8 d of treatment (2 h after the last dose).
Flow cytometry. For cell cycle analysis, cell suspensions were fixed in 70% ethanol and stained with propidium iodide (Invitrogen) and DNase-free RNase A (Sigma-Aldrich) at final concentrations of 50 and 20 μg/mL, respectively. Apoptotic cells were detected using a protocol provided with the APO-BrdU terminal deoxyribonucleotidyl transferase–mediated dUTP nick end labeling (TUNEL) assay (Invitrogen). Flow cytometric data analysis and visualization were conducted using FlowJo v8.4 software (Tree Star, Inc.).
Breast tumor samples. Primary breast tumors from 29 independent breast cancer patients obtained from the Genentech Tumor Bank were used to make mRNA for analysis on Human Genome U133P 2.0 Array chips (Affymetrix). Tumors were assigned to molecular subtypes using the method of subtype centroids described by Hu et al. (21). In brief, each tumor was assigned to the subtype whose gene expression centroid had the highest Spearman correlation to the expression profile of the tumor (22).
Somatic mutation data in breast cell lines and tumors. Exonic regions were amplified by PCR of genomic DNA and sequenced in both directions using Big Dye Terminator Kit reagents and ABI PRISM 3730xl sequencing machines (Applied Biosystems). Sequence variants were identified using Mutation Surveyor software (SoftGenetics) and confirmed by manual trace review and a second round of sequencing. DNA from all cell lines, Oncotest tumors, and breast tumor samples were analyzed for PIK3CA, PTEN, BRAF, KRAS, HRAS, NRAS, and RRAS2 sequence alterations.
Gene expression microarray studies. Gene expression analysis of breast cancer cell lines was carried out on RNA extracted from subconfluent cell cultures using Qiagen RNAeasy kits. RNA quality was verified by running samples on an Agilent Bioanalyzer 2100, and samples of sufficient quality were profiled on Affymetrix HGU133Plus_2.0 chips. Preparation of complementary RNA, array hybridizations, scanning, and subsequent array image data analysis were done using the manufacturer's specified protocol. Detailed descriptions of the bioinformatic analyses described are presented in Supplementary Experimental Procedures. All gene expression data described in this study have been deposited in the Gene Expression Omnibus database under accession no. GSE12790.
Identification of activated RAS and MEK signatures. We developed pathway activation signatures for HRAS (G12V) and MEK (S217E221E) using a variation of the strategy used by Bild et al. (23). Detailed descriptions of the protocols and statistical analyses are provided in Supplementary Experimental Procedures. Recombinant adenoviruses expressing GFP, HRAS (G12V), and MEK1 (S217E S221E) transgenes, as well as null control vectors, were used at optimal multiplicity of infection. Expression on transfection for MEK1(gf) and HRAS(gf) was confirmed by Western blot, and isolated RNA was reversed transcribed to cDNA and then run on Human Genome U133P 2.0 Array chips (Affymetrix). At least five independent replicates were profiled for each expression construct. Differentially expressed genes between cells infected with control vector and MEK(gf) or RAS(gf) vectors were identified with the Cyber-T algorithm (24). Pathway activation signatures were developed using training and test data sets as described in detail in Supplementary Experimental Procedures, and predicted pathway activation levels derived from the model for each cell line are shown in Supplementary Table S1.
Results
In vitro sensitivity to MEK inhibition in breast cancer cell lines. We screened 50 breast cancer cell lines for in vitro sensitivity to the selective MEK inhibitor PD0325901. Cell lines were classified into molecular subtypes (basal-like, HER2, or luminal) based on unsupervised hierarchical clustering using gene expression data as well as HER2 copy number determined by quantitative reverse transcription-PCR on genomic DNA, as described previously (11). Figure 1A shows the in vitro sensitivity to MEK inhibition for each cell line as determined by a standard ATP-based viability assay. Sample cell viability assay curves are shown in Supplementary Fig. S1A. Cell lines classified as basal-like were significantly more sensitive to MEK inhibition relative to luminal and HER2-amplified lines. Specifically, 13 of 21 basal-like lines had an EC50 of <1 μmol/L, whereas only 2 of 29 luminal and HER2 lines had an EC50 of <1 μmol/L (P < 0.0001, Fisher's exact test). PD0325901 has been reported to have exquisite specificity for MEK1/2 based on profiling against a panel of ∼80 kinases (besides MEK1/2, only MKK5 was substantially inhibited starting at a concentration of 2 μmol/L; ref. 25); thus, EC50 values <1 μmol/L are likely to reflect on-target effects of inhibiting MEK1/2. In addition, we note that basal-like lines such as CAL85-1 typically show 50% to 60% inhibition in a 3-day viability assay (Supplementary Fig. S1), thus showing a similar magnitude of inhibitory response to that described for RAS-mutant cell lines and somewhat less than the dramatic hypersensitivity and 90% to 95% inhibition described for BRAF-mutant cell lines (26). Of the two non–basal-like lines that showed submicromolar sensitivity, the HER2-amplified line HCC1954 is reported to have an overall basal-like gene expression profile (27), in contrast to the majority of HER2-amplified cell lines, which cluster with luminal cell lines in unsupervised analyses. The luminal cell line MDA-MB-175VII has been reported to have an autocrine growth loop mediated by γ-heregulin that results in constitutive signaling through the MAPK pathway (28). To show that this selective growth inhibition of basal-like cell lines is not a compound-specific or off-target effect of PD0325901, we determined that a second MEK inhibitor (9) also had significant antiproliferative effects in several basal-like cell lines but not in luminal or HER2-amplified cell lines (Supplementary Fig. S1B). We also confirmed PD0325901 inhibition of proliferation as determined by reduced bromodeoxyuridine incorporation in an immunofluorescence assay for a subset of lines and saw more dramatic effects in basal-like than luminal cell lines in this assay format as well (Supplementary Fig. S1C and data not shown). In addition, we determined PTEN and EGFR protein expression for each of the cell lines (Fig. 1A; Supplementary Fig. S2) because PTEN loss and EGFR overexpression have been described as common events in basal-like breast cancer (6). Indeed, we found that basal-like cell lines were more likely to harbor loss of PTEN protein and express detectable EGFR than luminal or HER2-amplified cell lines (Fisher's exact test, P < 0.001 for EGFR, P < 0.01 for PTEN). The majority of the cell lines exhibiting loss of PTEN protein expression do not harbor coding sequence mutations in the PTEN gene (14), consistent with previous studies suggesting that PTEN loss in breast cancer is primarily due to promoter methylation, loss of heterozygosity, or regulation at the RNA or protein level (29). Interestingly, we found that within the basal-like lines, PTEN protein loss was associated with reduced response to MEK inhibition because 10 of 11 lines with intact PTEN had EC50 values of <1 μmol/L, whereas only 3 of 10 lines with deleted PTEN had EC50 values of <1 μmol/L (P = 0.022, Fisher's exact test). We also used quantitative reverse-phase protein microarrays to assess levels of pAkt (S473) across the cell line panel and observed significantly higher pAkt (S473) in basal-like cell lines resistant to MEK inhibition (P < 0.001, Student's t test; Fig. 1A). This is consistent with recent findings that loss of PTEN is strongly associated with high levels of pAkt in breast cancer cell lines and tumors (30), and suggests a model in which activation of Akt signaling via PTEN loss may desensitize a subset of basal-like breast cancer cells to MEK inhibition. In addition, we sequenced core members of the RAS and RAF family of genes from all of the cell lines (Fig. 1A) and found mutations in four basal-like cells lines, DU4475 (BRAF), Hs578t (HRAS), MDA-MB-231 [KRAS (G12V) and BRAF (G464V)], and CAL-51 (RRAS2), but not in any of the luminal or HER2-amplified lines. Mutations in RRAS2 have been previously described in CAL-51 (31) and shown to result in transformation in NIH-3T3 cells (32). Finally, we sequenced PIK3CA, the gene encoding the catalytic subunit of PI3K (Fig. 1A), in all of the cell lines and found that PIK3CA alterations are common in HER2-amplified and luminal cell lines but rare in basal-like breast cancer cell lines, and thus are not likely to play a significant role in MEK inhibitor response in basal-like cells.

In vitro response of breast cancer cell lines to MEK inhibition. A, sensitivity to a MEK inhibitor in a panel of breast cancer cell lines as determined by EC50 in a cell viability assay. Note that the y axis is graphed on a logarithmic scale to better show distinctions between cell lines with submicromolar sensitivity. Responses below 1 μmol/L (indicated by the red dashed line) may represent off-target effects of the MEK inhibitor and should be interpreted with caution. Cell lines are classified into major subtypes of breast cancer, basal-like, HER2-amplified, and luminal, based on gene expression profiling. The text below the graph indicates cell lines determined to have detectable expression of EGFR protein (+) or the presence of activating mutations in BRAF, HRAS, RRAS2, or KRAS; activating mutations in PIK3CA; or loss of PTEN (NULL), by Western blot. The heat map indicates phosphorylation levels of Akt (S473) as assessed by quantitative analysis using reverse-phase protein microarrays and is color coded according to z-scores (−2, low/absent; 0, moderate; +2, high). B, Western blots showing modulation of phospho-ERK (pERK), p27, and cyclin D1 after treatment with a MEK inhibitor in five breast cancer cell lines. HDQ-P1, CAL85-1, and MDA-MB-231 are sensitive to MEK inhibition of cell viability, but BT474 and MCF-7 are not. Note that pERK is suppressed in all cell lines regardless of subtype and efficacy, whereas decreased cyclin D1 and increased p27 expression are seen only in basal-like cell lines that are sensitive to MEK inhibition.
In vitro response of breast cancer cell lines to MEK inhibition. A, sensitivity to a MEK inhibitor in a panel of breast cancer cell lines as determined by EC50 in a cell viability assay. Note that the y axis is graphed on a logarithmic scale to better show distinctions between cell lines with submicromolar sensitivity. Responses below 1 μmol/L (indicated by the red dashed line) may represent off-target effects of the MEK inhibitor and should be interpreted with caution. Cell lines are classified into major subtypes of breast cancer, basal-like, HER2-amplified, and luminal, based on gene expression profiling. The text below the graph indicates cell lines determined to have detectable expression of EGFR protein (+) or the presence of activating mutations in BRAF, HRAS, RRAS2, or KRAS; activating mutations in PIK3CA; or loss of PTEN (NULL), by Western blot. The heat map indicates phosphorylation levels of Akt (S473) as assessed by quantitative analysis using reverse-phase protein microarrays and is color coded according to z-scores (−2, low/absent; 0, moderate; +2, high). B, Western blots showing modulation of phospho-ERK (pERK), p27, and cyclin D1 after treatment with a MEK inhibitor in five breast cancer cell lines. HDQ-P1, CAL85-1, and MDA-MB-231 are sensitive to MEK inhibition of cell viability, but BT474 and MCF-7 are not. Note that pERK is suppressed in all cell lines regardless of subtype and efficacy, whereas decreased cyclin D1 and increased p27 expression are seen only in basal-like cell lines that are sensitive to MEK inhibition.
Pathway modulation by MEK inhibition in breast cancer cell lines. To determine the cellular consequences of MEK inhibition in breast cancer, we performed Western blotting experiments before and after treatment with two different concentrations of PD0325901 on three cell lines that are sensitive to MEK inhibition (HDQ-P1, CAL85-1, and MDA-MB-231) and two non–basal-like cell lines that are insensitive to MEK inhibition (BT474 and MCF-7; Fig. 1B). In all five cases, we found that treatment with the MEK inhibitor resulted in reduction of pERK, a direct readout of MEK1 and MEK2 activity, at both 6 and 24 hours (Fig. 1B). A number of studies have shown that activation of the MEK/ERK pathway is linked to expression of cyclin D1 and that this is an important component of progression through the G1 phase of the cell cycle (33). The MEK/ERK pathway is also thought to regulate cell cycle progression and proliferation by degradation of the cyclin D1–dependent kinase inhibitor p27 (34). Based on these observations, we determined the effects of MEK inhibition on cyclin D1 and p27 expression in breast cancer cell lines. Notably, we did not see any substantial differences in the levels of the cell cycle regulators p27 or cyclin D1 on treatment in insensitive BT474 or MCF-7 cells but observed elevated p27 levels and decreased cyclin D1 levels in all three responsive cell lines (Fig. 1B). In addition, we observed G1 arrest in sensitive HDQ-P1 cells treated with MEK inhibitor (Supplementary Fig. S1D), suggesting that the antiproliferative mechanism of action is likely similar to that reported in BRAF- and KRAS-mutant models. Together these results suggest that pERK knockdown is not sufficient for efficacy in response to a MEK inhibitor, that alterations in the abundance of cell cycle regulators may serve as early pharmacodynamic indicators of efficacy, and that the mechanism of action of MEK inhibitors in basal-like breast cancer may involve cyclin D1 down-regulation and accumulation of the negative regulator p27.
MEK inhibitor activity in breast cancer xenograft models. To confirm that the sensitivity to MEK inhibitors in basal-like breast cancer cell lines is not specific to in vitro growth in monolayer culture, we sought in vivo confirmation of this finding. We evaluated antitumor activity of PD0325901 in flank-implanted xenografts of the in vitro sensitive cell line MDA-MB-231 (basal-like), as well as the in vitro resistant cell line BT474 (HER2 amplified). As shown in Fig. 2A, daily dosing for 21 consecutive days in MDA-MB-231 xenograft mice resulted in significant reduction of tumor size relative to vehicle-treated controls at all four doses examined, ranging from 68% inhibition at a dose of 2.5 mg/kg to 84% inhibition at a dose of 25 mg/kg. In comparison, daily dosing of mice harboring xenografts of the HER2-amplified line BT474 at levels up to 25 mg/kg did not show any significant inhibition of tumor growth relative to vehicle (Fig. 2B). We also sought confirmation of MEK inhibitor activity in primary tumor explant models that we determined have basal-like breast cancer characteristics such as lack of expression of ER, PR, and HER2 and high expression of vimentin, EGFR, and other basal-like markers (Supplementary Fig. S3). These tumor models are derived from patient tumors that have been transplanted s.c. directly into nude mice and are reported to have maintained their typical tumor histology, including a stromal component and vasculature (35), and hence may be somewhat more representative of actual patient tumors. We used Sanger sequencing to determine that these tumors are wild-type at the BRAF, HRAS, and KRAS loci and that they express PTEN protein based on Western blot analysis and have low levels of pAkt (data not shown). Daily dosing of the basal-like models MAXF-1384 and MAXF-401 with 12.5 mg/kg MEK inhibitor resulted in significant reduction of tumor growth (75% and 67%, respectively) and near stasis compared with vehicle-treated animals (Fig. 2C and D). To confirm pathway inhibition in these models, we ran Western blots on end-of-study tumors from both vehicle- and MEK inhibitor–treated animals harboring MAXF-1384 and MAXF-401 tumors (Supplementary Fig. S4). In both cases, we saw significant down-regulation of pERK and up-regulation of p27 in the tumors from MEK inhibitor–treated animals compared with vehicle-treated animals, confirming both proximal pathway effects on the MEK substrate ERK and distal cell cycle effects that can be attributed to MEK inhibition. We were unable to assess cyclin D1 down-regulation in these tumors due to cross-reactivity of the antibody with mouse cyclin D1. BT474 tumors were also analyzed for pERK and p27 levels and showed substantial reduction of pERK but no change in p27 levels after treatment (Supplementary Fig. S4), consistent with the in vitro results from Fig. 1, and again suggesting that pERK knockdown may be necessary but is not sufficient for efficacy in response to MEK inhibition. Altogether, these in vivo studies support the in vitro findings that MEK inhibition has in antitumor activity specifically in breast cancers with a basal-like phenotype, including explants derived directly from patients with basal-like breast cancer.

A MEK inhibitor has in vivo antitumor activity in basal-like breast cancer xenograft models. A and B, 21-d daily dosing of flank-xenografted MDA-MB-231 basal-like cells substantially reduced tumor growth in a dose-dependent manner, whereas 21-d daily dosing of flank-xenografted BT474 HER2-amplified cells with doses of up to 25 mg/kg did not result in notable reduction of tumor growth compared with vehicle. Tumor volumes represent means from measurements in 10 tumor-bearing mice. C and D, daily dosing of basal-like human primary tumor explant xenograft models MAXF-401 and MAXF-1384 with either 12.5 mg/kg MEK inhibitor or vehicle for 20 d resulted in substantial reduction of tumor growth in animals dosed with the MEK inhibitor.
A MEK inhibitor has in vivo antitumor activity in basal-like breast cancer xenograft models. A and B, 21-d daily dosing of flank-xenografted MDA-MB-231 basal-like cells substantially reduced tumor growth in a dose-dependent manner, whereas 21-d daily dosing of flank-xenografted BT474 HER2-amplified cells with doses of up to 25 mg/kg did not result in notable reduction of tumor growth compared with vehicle. Tumor volumes represent means from measurements in 10 tumor-bearing mice. C and D, daily dosing of basal-like human primary tumor explant xenograft models MAXF-401 and MAXF-1384 with either 12.5 mg/kg MEK inhibitor or vehicle for 20 d resulted in substantial reduction of tumor growth in animals dosed with the MEK inhibitor.
Gene expression markers of response to MEK inhibition in basal-like breast cancer. We set out to understand the underlying mechanistic basis for sensitivity of basal-like breast cancers to MEK inhibition through analysis of gene expression signatures. It is notable that only 4 of the 15 breast cancer cell lines that are sensitive to MEK inhibition in vitro harbor known mutations in RAS or RAF family members, suggesting that other factors must contribute to sensitize these cells to respond to MEK inhibition. We first took an unbiased approach to shed light on these other factors by examining genes that are differentially expressed between sensitive and resistant cell lines (Supplementary Table S1; Fig. 3A). Notable genes identified through this approach include the receptor tyrosine kinases fibroblast growth factor receptor 2 and c-Met and the negative regulator of RAS signaling, Sprouty2 (36). We also used gene set enrichment analysis on a collection of more than 1,000 publicly available gene sets to identify biological modules that were enriched among the differentially expressed genes (37). The 10 most significant gene sets are listed in Supplementary Table S2. The top gene set (P < 0.0001) was the Broad Institute/MIT “Breast Cancer ER negative” data set of 475 genes whose expression is consistently correlated with ER status (37). This finding is consistent with the observation that basal-like, hormone receptor–negative cell lines are the most responsive to MEK inhibition. Interestingly, the second gene set identified (P < 0.0001) was a collection of genes whose expression has been shown to be induced by HRAS expression in IMR90 fibroblasts (38). Together these results reinforce the association between subtype and sensitivity and also suggest that basal-like tumors have similarities at the transcriptional level to tumor models harboring activated RAS mutations and that this may sensitize them to respond to MEK inhibition.
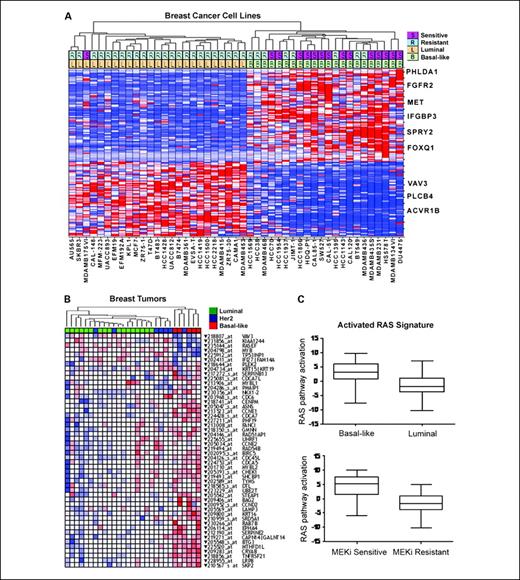
Oncogenomic signature determinants of MEK inhibitor response in basal-like breast cancer. A, gene expression signature derived from supervised analysis to identify genes differentially expressed between MEK-sensitive and MEK-resistant cell lines. Hierarchical clustering of cell lines was done with the top 100 differentially expressed genes defined by max/min ratio across the cell line panel. Cell lines are shown on the horizontal axis, and select gene identities on the vertical axis. The two rows at the top of the figure show MEK inhibitor–sensitive (S) and MEK inhibitor–resistant (R) cell lines as well as luminal (L) or basal-like (B) phenotype as determined by overall gene expression. Select genes are indicated to the right of the heat map. B, an activated Ras/MEK signature from cell lines is enriched in basal-like tumors. HRAS or MEK gain-of-function mutant proteins were expressed in MCF-10A cells and supervised analyses were used to identify the 50 most differentially expressed genes in common between these experiments. Probes representing these genes were used to perform unsupervised hierarchical clustering on independent breast cancer tumor samples that had been classified into different molecular subtypes (luminal, basal-like, or HER2 amplified) based on independent gene expression analysis. The subtype of each sample is indicated by color coding in the top row according to the key in the figure. In the heat map, red indicates high expression and blue indicates low expression of a given probe. C, basal-like and MEK inhibitor–sensitive cell lines have an activated RAS signature. Predictive classifiers of RAS pathway activation were developed from gene expression data derived from MCF-10A cells expressing mutant HRAS and used to classify breast cancer cell lines. The y axis indicates predicted RAS pathway activation based on a scalar predictor. The x axes show cell lines divided into molecular subtypes (top) and into MEK inhibitor–sensitive and MEK inhibitor–resistant classes (bottom)
Oncogenomic signature determinants of MEK inhibitor response in basal-like breast cancer. A, gene expression signature derived from supervised analysis to identify genes differentially expressed between MEK-sensitive and MEK-resistant cell lines. Hierarchical clustering of cell lines was done with the top 100 differentially expressed genes defined by max/min ratio across the cell line panel. Cell lines are shown on the horizontal axis, and select gene identities on the vertical axis. The two rows at the top of the figure show MEK inhibitor–sensitive (S) and MEK inhibitor–resistant (R) cell lines as well as luminal (L) or basal-like (B) phenotype as determined by overall gene expression. Select genes are indicated to the right of the heat map. B, an activated Ras/MEK signature from cell lines is enriched in basal-like tumors. HRAS or MEK gain-of-function mutant proteins were expressed in MCF-10A cells and supervised analyses were used to identify the 50 most differentially expressed genes in common between these experiments. Probes representing these genes were used to perform unsupervised hierarchical clustering on independent breast cancer tumor samples that had been classified into different molecular subtypes (luminal, basal-like, or HER2 amplified) based on independent gene expression analysis. The subtype of each sample is indicated by color coding in the top row according to the key in the figure. In the heat map, red indicates high expression and blue indicates low expression of a given probe. C, basal-like and MEK inhibitor–sensitive cell lines have an activated RAS signature. Predictive classifiers of RAS pathway activation were developed from gene expression data derived from MCF-10A cells expressing mutant HRAS and used to classify breast cancer cell lines. The y axis indicates predicted RAS pathway activation based on a scalar predictor. The x axes show cell lines divided into molecular subtypes (top) and into MEK inhibitor–sensitive and MEK inhibitor–resistant classes (bottom)
To further explore the possibility that basal-like breast cancers tend to have activated RAS/MEK pathway signaling and that this activity leads to MEK inhibitor sensitivity, we used a variation of the method described by Bild et al. (23) to identify genomic predictors of oncogenic pathway activation. The strategy was to independently identify expression signatures of RAS and MEK activation and use those signatures to assess the status of RAS/MEK pathway activity in a given cell line or tumor. As described in detail in Supplementary Experimental Procedures, we expressed gain of function (gf) versions of HRAS (39) or MEK1 (40) in the immortalized but nontransformed cell line MCF-10A. Supervised analysis of gene expression data was first used to identify genes that showed differential expression between control virus–infected cells and RAS(gf)- or MEK(gf)-infected cells. The list of the top 50 differentially expressed genes is shown in Supplementary Table S3. Notably, this list includes several members of the cyclin family (CCNE1, CCNE2, and CCND2) and also includes genes that have been linked to MEK signaling in other contexts. For instance, α-basic-crystallin (CRYAB) has been shown previously to be expressed in basal-like breast carcinomas and to predict shorter survival, as well as to mediate transformation in a MEK-dependent manner (41). To ascertain the relevance of this signature to the biology of breast cancer, we used probes for the top 50 differentially expressed genes to perform unsupervised hierarchical clustering on 29 breast tumor samples. We found that the genes that constitute the RAS/MEK(gf) signature from MCF-10A cells are coordinately expressed in tumor samples and that significant up-regulation of RAS and MEK target genes is preferentially seen in tumors independently classified as basal-like (Fig. 3B).
We next used Affymetrix microarray data from control cells and from RAS(gf) or MEK(gf) cells to train a predictive model that could distinguish high from low RAS/MEK pathway activation. We applied this model to predict pathway activity in our independent collection of breast cancer cell lines (Supplementary Table S4). This enabled us to examine the relationships between predicted pathway activity, subtype, and sensitivity to MEK inhibition. To see whether these relationships extended beyond cell lines with known RAS and RAF activating mutations, we excluded those lines from this analysis. As shown in Fig. 3C, basal-like cell lines without RAS/RAF mutations are predicted to have significantly higher probability of RAS/MEK pathway activation compared with luminal cell lines (P = 0.0002, two-sided Wilcoxon rank sum test). In addition, a key finding from these studies is that cell lines with submicromolar sensitivity to MEK inhibitor are predicted to have elevated predicted RAS/MEK pathway activation (P = 0.0002, two-sided Wilcoxon rank sum test; Fig. 3C). Because we excluded cell lines harboring known RAS and RAF mutations from these analyses, these results offer independent confirmation that basal-like cell lines have characteristics of RAS/MEK activation despite not harboring known oncogenic mutations, and that gene expression–based models of RAS/MEK activation may have utility in predicting sensitivity to MEK inhibitors.
Role of EGFR in MEK inhibitor sensitivity. One possible explanation for the presence of an activated RAS signature in basal-like cancers is that constitutively high expression of EGFR or other receptor tyrosine kinases in basal-like lines leads to elevated signaling through the RAS/RAF/MEK/MAPK pathway and renders these cells dependent on the pathway and, thus, sensitive to MEK inhibition. Consistent with this hypothesis, we found that our predictions of RAS/MEK pathway activity in breast cancer cell lines were highly correlated with those from a previously published EGFR signature (ref. 6; P < 0.0001, Fig. 4A). To test the functional significance of EGFR signaling in breast cancer, we screened our breast cancer panel for in vitro sensitivity to the selective EGFR inhibitor erlotinib (Tarceva, Genentech) and observed that basal-like cell lines are more sensitive to EGFR inhibition than are luminal cell lines (P < 0.001, Fisher's exact test; Fig. 4B). However, only three cell lines (HDQ-P1, CAL85-1, and HCC1806) showed submicromolar sensitivity to erlotinib, suggesting that the dramatic sensitivity observed in response to MEK inhibition likely cannot be fully explained by EGFR signaling through the RAS pathway. HER2-amplified cell lines also showed sensitivity to erlotinib in the 2 to 5 mmol/L range, although this may possibly be due to off-target effects on HER2 because the majority of these cell lines do not express EGFR (Supplementary Fig. S2) and it has been shown that erlotinib can directly inhibit HER2 kinase activation in cells lacking EGFR expression (42). To evaluate whether EGFR signals through MEK and ERK in sensitive basal-like cells, we treated cells for 6 hours with erlotinib and assessed phospho-ERK levels before and after treatment. Sensitive CAL85-1 cells showed a dramatic reduction in pERK, whereas MDA-MB-231 cells that harbor a mutation in the downstream effector KRAS showed no reduction in pERK (Supplementary Fig. S5). To further test the functional link between EGFR signaling and MEK activation, we performed RNA interference studies comparing the effect of EGFR knockdown with that of EGFR-targeting siRNAs on sensitivity to MEK inhibition in breast cancer cell lines of differing subtypes and genetic backgrounds. To show that the results obtained with the siRNA pools were not due to off-target effects of the siRNA mix, we showed similar effects with two individual siRNA duplexes and also determined that transcript levels were reduced by 80% to 85% on siRNA transfection (Supplementary Fig. S6). CAL85-1 express high levels of EGFR and are responsive to erlotinib, and RNA interference–mediated knockdown of EGFR resulted in reduced cell viability even in the absence of MEK inhibition in these cells (Fig. 4C). Importantly and perhaps due to the partial knockdown observed, the EGFR siRNAs only reduced cell viability by 50%, allowing us to determine whether MEK inhibition could enhance the effects of reduction of EGFR function. Notably, we found that both 0.1 and 1.0 μmol/L MEK inhibitor treatment resulted in significantly reduced cell viability compared with EGFR siRNA alone (e.g., 80% reduction for EGFR siRNA and 0.1 μmol/L MEK inhibitor compared with a 50% reduction for EGFR siRNA alone). In contrast, analogous studies in the KRAS-mutant cell line MDA-MB-231 and the HER2-amplified cell line JIMT-1 revealed that EGFR knockdown alone had little or no effect on cell viability and did not enhance the inhibitory effects of MEK inhibition on cell viability in these cell lines (Fig. 4C), suggesting a lack of dependency on EGFR signaling in these cell lines. These results are consistent with a model in which a subset of basal-like cell lines without known oncogenic mutations (e.g., HDQ-P1, HCC1806, and CAL85-1) are dependent on high levels of EGFR signaling through RAS and MEK and thus are sensitive to inhibition at key nodes in this pathway. However, the relative lack of potency of erlotinib compared with MEK inhibition, coupled with the fact that not all basal-like cell lines express EGFR, suggests a model in which signaling via other upstream receptors may also stimulate RAS activity and activate the MEK pathway.
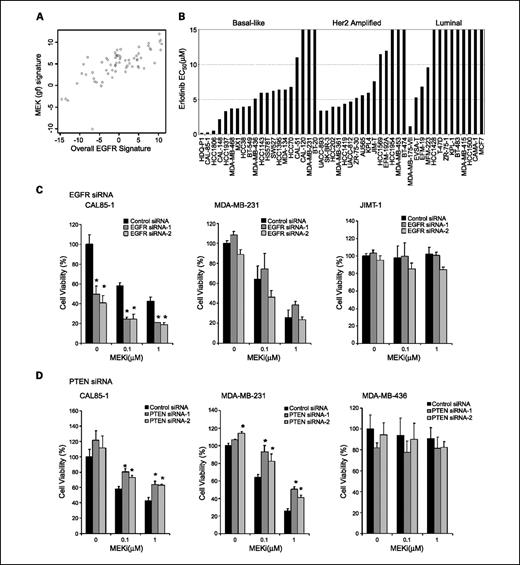
Functional analysis of EGFR signaling and PTEN in basal-like breast cancer. A, the MEK(gf) signature (y axis) is correlated with a published EGFR signature (x axis). Overall gene signature levels were calculated as described in Supplementary Experimental Procedures. Each point represents a single cell line. B, cell lines of the basal-like subtype show greater in vitro sensitivity to the EGFR inhibitor erlotinib compared with luminal or HER2-amplified cell lines. Cell lines are classified into major subtypes as described for Fig. 1, and cell viability was assessed in a 3-d ATP-based viability assay. C, EGFR siRNA knockdown and effects on MEK inhibitor sensitivity in a basal-like line without known RAS or RAF mutations (CAL85-1), a basal-like cell line with a KRAS mutation (MDA-MB-231), and a HER2-amplified cell line (JIMT-1). The y axis indicates percent cell viability relative to untreated nontarget control siRNA–treated cells, and the x axis indicates MEK inhibitor concentration. Light gray columns, nontarget control siRNA–treated cells; dark gray columns, EGFR siRNA–treated cells. EGFR siRNA affects viability and enhances the effects of MEK inhibition in CAL85-1, but not MDA-MB-231 or JIMT-1, cells (*, P < 0.05, Student's t test). D, effects of a MEK inhibitor on basal-like cell lines with intact PTEN or where PTEN has been ablated by RNA interference. The cell lines are labeled above each graph. The y axis of each chart shows percent cell viability normalized to nontarget control siRNA–treated cells in the absence of MEK inhibitor, whereas the x axis indicates the concentration of MEK inhibitor. Dark gray columns, cells treated with control siRNA; light gray columns, cells treated with two independent PTEN siRNA duplexes as indicated in the key. Bars, SDs calculated from duplicate experimental wells. PTEN siRNA treatment significantly reduced inhibition in response to treatment with two different concentrations of MEK inhibitor in CAL-85-1 and MDA-MB-231 cells (*, P < 0.05, Student's t test). As a control for specificity of the siRNA duplexes, PTEN siRNA was done in the PTEN-null cell line MDA-MB-436 and had no effect on cell viability compared with control siRNA.
Functional analysis of EGFR signaling and PTEN in basal-like breast cancer. A, the MEK(gf) signature (y axis) is correlated with a published EGFR signature (x axis). Overall gene signature levels were calculated as described in Supplementary Experimental Procedures. Each point represents a single cell line. B, cell lines of the basal-like subtype show greater in vitro sensitivity to the EGFR inhibitor erlotinib compared with luminal or HER2-amplified cell lines. Cell lines are classified into major subtypes as described for Fig. 1, and cell viability was assessed in a 3-d ATP-based viability assay. C, EGFR siRNA knockdown and effects on MEK inhibitor sensitivity in a basal-like line without known RAS or RAF mutations (CAL85-1), a basal-like cell line with a KRAS mutation (MDA-MB-231), and a HER2-amplified cell line (JIMT-1). The y axis indicates percent cell viability relative to untreated nontarget control siRNA–treated cells, and the x axis indicates MEK inhibitor concentration. Light gray columns, nontarget control siRNA–treated cells; dark gray columns, EGFR siRNA–treated cells. EGFR siRNA affects viability and enhances the effects of MEK inhibition in CAL85-1, but not MDA-MB-231 or JIMT-1, cells (*, P < 0.05, Student's t test). D, effects of a MEK inhibitor on basal-like cell lines with intact PTEN or where PTEN has been ablated by RNA interference. The cell lines are labeled above each graph. The y axis of each chart shows percent cell viability normalized to nontarget control siRNA–treated cells in the absence of MEK inhibitor, whereas the x axis indicates the concentration of MEK inhibitor. Dark gray columns, cells treated with control siRNA; light gray columns, cells treated with two independent PTEN siRNA duplexes as indicated in the key. Bars, SDs calculated from duplicate experimental wells. PTEN siRNA treatment significantly reduced inhibition in response to treatment with two different concentrations of MEK inhibitor in CAL-85-1 and MDA-MB-231 cells (*, P < 0.05, Student's t test). As a control for specificity of the siRNA duplexes, PTEN siRNA was done in the PTEN-null cell line MDA-MB-436 and had no effect on cell viability compared with control siRNA.
PTEN knockdown reduces the effects of a MEK inhibitor on cell viability and cell cycle progression. Given the association observed between lack of PTEN protein and reduced sensitivity to MEK inhibition in the cell line screen, we sought to determine whether ablation of PTEN by RNA interference would alter the inhibitory effects of MEK inhibition on cell viability. We selected one basal-like cell line with a KRAS (G12V) alteration (MDA-MB-231), one basal-like line with no apparent mutational activation of the pathway (CAL85-1), and a control basal-like cell line that lacks expression of PTEN mRNA and protein (MDA-MB-436). We then performed RNA interference–mediated knockdown of PTEN in all of these cells followed by treatment with two concentrations of MEK inhibitor (Fig. 4D). Knockdown of PTEN with two independent siRNA duplexes at the mRNA level was confirmed by quantitative reverse transcription-PCR (Supplementary Fig. S6). In both MDA-MB-231 and CAL85-1 cells, PTEN knockdown resulted in an increase in cell viability compared with control cells in the absence of treatment with the MEK inhibitor, consistent with the role of PTEN as a tumor suppressor gene. In addition, PTEN knockdown significantly blunted the inhibitory effects of MEK inhibition on cell viability in these cell lines. Specifically, cells with PTEN knockdown treated with 1 μmol/L MEK inhibitor showed, on average, 60% viability compared with 40% in control siRNA cells for CAL85-1 and 44% compared with 24% for MDA-MB-231 cells (Fig. 4D). As a control for specificity of the siRNA duplexes to PTEN, we performed siRNA knockdown in a PTEN-null line and showed no effect on cell viability relative to cells transfected with a control siRNA, suggesting that the observed effects are due to PTEN knockdown. To address specific cell cycle effects of PTEN ablation in RAS-driven cancers, we conducted flow cytometric DNA content analyses in MDA-MB-231 KRAS-mutant cells. We compared cell cycle profiles before and after treatment with 1 μmol/L MEK inhibitor and found that PTEN siRNA significantly reduced G1 arrest induced by the MEK inhibitor (Supplementary Fig. S7) from 73.9% in control siRNA–treated cells to 56.9% in cells transfected with a PTEN-targeting siRNA. This result suggests that loss of PTEN renders RAS-driven cancer cells relatively less responsive to the inhibitory effects of MEK inhibition and may do so by decreasing the fraction of cells undergoing G1 arrest.
Effects of combined MEK and PI3K inhibition on cell viability and apoptosis. Because activation of the PI3K pathway by PTEN loss reduces the effects of MEK inhibition in cell lines, we sought to investigate whether dual inhibition of both MEK and PI3K might result in synergistic effects on cell growth inhibition or apoptosis induction in breast cancer cells. To inhibit PI3K, we used the selective PI3K inhibitor GDC-0941, a novel compound with low nanomolar IC50s against all four isoforms of class I PI3K that is currently in phase I clinical development (43). We first examined the effects of single-agent MEK or PI3K inhibition as compared with combination treatment on the state of pathway activation (as determined by phosphorylation of ERK and Akt) in the resistant, high-pAkt cell line Hs578t and the sensitive, low-pAkt cell line CAL85-1. Intriguingly, we found that MEK inhibitor treatment alone not only reduced ERK phosphorylation but also markedly increased pAkt levels both cell lines (Fig. 5A), consistent with the existence of a feedback loop whereby inhibition of the MEK/ERK pathway results in concomitant up-regulation of signaling through the PI3K/Akt pathway. To confirm that increased pAkt in response to MEK inhibition was not unique to these cell lines, we assessed pAkt (S473) levels in response to 6-hour MEK inhibitor treatment in a range of cell lines of differing subtypes on reverse-phase protein arrays, and found that all of the cell lines showed elevated levels of pAkt (S473) compared with control-treated cells (Supplementary Fig. S8). In contrast, GDC-0941 treatment resulted in diminished pAkt levels but did not appreciably affect pERK levels in these cell lines. Notably, the combination of PI3K and MEK inhibitors resulted in near-complete blockade of both pERK and pAkt. In addition, we examined the effects of the treatments on cyclin D1 levels and found that in both cell lines, treatment with 1 μmol/L MEK inhibitor resulted in substantial reduction in cyclin D1 levels, treatment with 1 μmol/L PI3K inhibitor had a modest effect, and cotreatment with the two agents resulted in a more dramatic reduction in cyclin D1 levels (Fig. 5A; Supplementary Fig. S10). This effect was particularly strong in CAL85-1 cells.

Effects of dual treatment with MEK and PI3K inhibitors on pathway signaling and cell viability in basal-like breast cancer. A, Western blot analysis of ERK and Akt phosphorylation and cyclin D1 levels in the presence of single agent MEK inhibitor, single agent PI3K inhibitor, or a combination. Compounds were added at either 0.1 or 1.0 μmol/L as indicated and lysates were prepared after 6 h of treatment. Further quantitation of cyclin D1 levels is provided in Supplementary Fig. S9. B, combination of MEK and PI3K inhibitors has synergistic effects on viability in two basal-like cell lines (Hs578t and CAL85-1) but not luminal (MCF-7) or HER2-amplified (JIMT-1) cell lines. Inhibitors were used either singly or in combination in a fixed dose ratio and cell viability was assessed in a luminescence-based viability assay. The y axis indicates viability relative to vehicle-treated control cells. Actual concentrations for each compound are given in Supplementary Experimental Procedures. A measure of synergy, the combination index (CI), is also shown for the MEK-PI3K inhibitor combination for each cell line. Combination index values of <0.5 generally indicate synergistic effects on cell viability. C, caspase activation in response to MEK, PI3K, or combined inhibition in a panel of cell lines. Strong combination effects are limited to basal-like cell lines. Pathway status as assessed by quantitative protein array analysis of pAkt (S473), PTEN protein status, or oncogenic mutations are indicated below the figure (*, P < 0.05, Student's t test).
Effects of dual treatment with MEK and PI3K inhibitors on pathway signaling and cell viability in basal-like breast cancer. A, Western blot analysis of ERK and Akt phosphorylation and cyclin D1 levels in the presence of single agent MEK inhibitor, single agent PI3K inhibitor, or a combination. Compounds were added at either 0.1 or 1.0 μmol/L as indicated and lysates were prepared after 6 h of treatment. Further quantitation of cyclin D1 levels is provided in Supplementary Fig. S9. B, combination of MEK and PI3K inhibitors has synergistic effects on viability in two basal-like cell lines (Hs578t and CAL85-1) but not luminal (MCF-7) or HER2-amplified (JIMT-1) cell lines. Inhibitors were used either singly or in combination in a fixed dose ratio and cell viability was assessed in a luminescence-based viability assay. The y axis indicates viability relative to vehicle-treated control cells. Actual concentrations for each compound are given in Supplementary Experimental Procedures. A measure of synergy, the combination index (CI), is also shown for the MEK-PI3K inhibitor combination for each cell line. Combination index values of <0.5 generally indicate synergistic effects on cell viability. C, caspase activation in response to MEK, PI3K, or combined inhibition in a panel of cell lines. Strong combination effects are limited to basal-like cell lines. Pathway status as assessed by quantitative protein array analysis of pAkt (S473), PTEN protein status, or oncogenic mutations are indicated below the figure (*, P < 0.05, Student's t test).
We next examined the consequences of dual inhibition of these pathways on cellular viability in these four cell lines using the Chou and Talalay fixed dose ratio method of assessing the combined effects of compounds on cell viability (18). In the basal-like cell lines Hs578t and CAL85-1, each compound alone had a significant effect on viability; the combination of PI3K and MEK inhibitors resulted in a highly synergistic reduction in cell viability in both cell lines with a combination index of <0.2, manifested as a significantly lower combination EC50 as well as greater inhibition of cell viability across a range of concentrations (Fig. 5B). In contrast, the luminal cell line MCF-7 and the HER2-amplified cell line JIMT-1 both showed substantially reduced viability in response to the PI3K inhibitor, no effect in response to the MEK inhibitor, and no synergistic or additive effects in response to the combination of compounds (Fig. 5B). Both JIMT-1 cells and MCF-7 cells show strongly reduced cyclin D1 protein levels in response to PI3K inhibition, modest reduction in response to MEK inhibition, and slight enhancement with the combination (Supplementary Fig. S10). Thus, cyclin D1 levels seem to be more tightly linked to MEK signaling in basal-like lines and to PI3K signaling in luminal and HER2-amplified lines.
To further explore the nature of this apparent synergy, we investigated the effects of combination MEK and PI3K inhibitor treatment on induction of apoptosis in cell lines of differing genetic backgrounds and levels of activation of the RAS and PI3K/Akt pathways. First, we used a TUNEL assay to determine induction of apoptosis in response to single-agent and combination treatment in a BRAF-mutant cell line (DU4475), basal-like cell lines with low (CAL85-1 and MDA-MB-231) and high activity of the Akt pathway (Hs578t and BT549), and a luminal cell line (MCF-7; Supplementary Fig. S10). DU4475 cells showed strong induction of apoptosis in response to single agent MEK inhibitor and this effect was not significantly enhanced by PI3K inhibition, suggesting that in BRAF-mutant models, single-agent MEK inhibition may be enough to trigger apoptosis in the absence of inhibition of the PI3K pathway, as has been reported previously (10). In addition, we found that basal-like cells with both low and high levels of Akt signaling showed enhanced induction of apoptosis in response to the combination, although the effect was modest in BT549 cells. In luminal MCF-7 cells, we did not see significant induction of TUNEL staining in response to either single agent or the combination despite the fact that this cell line harbors a mutation in the PIK3CA gene. We confirmed and extended these findings in additional cell lines using a cell-based assay for the presence of cleaved caspase-3 and caspase-7, a hallmark of activation of apoptotic signaling pathways (Fig. 5C). We found that three of four basal-like lines with low pAkt showed significant enhancement of apoptosis in the combination treatment when compared with either single agent. In addition, three of four basal-like cell lines with high pAkt (including two PTEN-null cell lines) also showed significant enhancement of apoptosis relative to either single agent. CAL-148 (PTEN null, PIK3CA mutant) cells did not show enhanced effects with the combination but showed significant induction of apoptosis in response to single-agent PI3K inhibition. In contrast, none of the HER2-amplified and luminal cell lines showed significant enhancement of apoptosis with the combination treatment. Taken together, these results suggest that basal-like lines with both high and low levels of Akt pathway activation, but not HER2-amplified or luminal cell lines (which have low RAS pathway activation), have the potential for enhanced apoptotic response to combined targeting of MEK and PI3K.
Combined MEK and PI3K inhibition shows superior efficacy in basal-like models in three-dimensional cultures and xenograft models. Our in vitro studies suggest a role for rational combination of MEK and PI3K inhibitors in basal-like tumor models with both high and low levels of basal Akt signaling. To extend these findings and ensure they were not artifacts of cellular growth in monolayer cultures on plastic, we explored the effects of combined targeting of MEK and PI3K in three-dimensional cultures of cell lines of different subtypes. Growth of mammary epithelial cells in three-dimensional cultures is thought to more closely recapitulate tumor biology in that that cells can organize into structures that more closely resemble in vivo tumor architecture (44), and thus may represent a useful surrogate for investigating physiologic and pharmacologic effects on tumor biology. We grew basal-like MDA-MB-231 cells and HER2-amplified BT474M1 cells on laminin-rich, reconstituted basement membrane under conditions in which they proliferated rapidly and formed solid acinar structures (Fig. 6A), then compared the effects of single agent inhibitors of MEK and PI3K or a combination of the two on cell viability under these growth conditions. In MDA-MB-231 cells, we observed that MEK inhibition potently inhibited cell proliferation both visually and based on an ATP-based viability assay; PI3K inhibition had modest effects; and the combination was significantly more potent than either single agent. In contrast, BT474M1 cells showed minimal loss of viability in response to MEK inhibition, potent killing by the PI3K inhibitor, but no enhancement over PI3K inhibition alone when the drugs were administered in combination (Fig. 6B). Thus, these results are consistent with a model in which basal-like cell lines with high RAS signaling and the potential to up-regulate Akt signaling in response to MEK inhibition show enhanced response to the combination, but HER2-amplified and luminal cell lines lack dependence on the RAS pathway and hence may show good response to PI3K inhibition but no additional benefit from concomitant MEK inhibition. We extended this finding from a three-dimensional culture to a true in vivo setting by challenging flank-implanted tumor xenografts of the basal-like KRAS-mutant cell line MDA-MB-231 with single agent PD0325901, single agent GDC-0941, or a combination of the two agents. Consistent with the in vitro studies, we observed modest reduction of tumor growth with GDC-0941 (43%), substantial inhibition (97%) in the presence of PD0325901, and a statistically significant increase in tumor growth inhibition (104%) in the combination arm and noted that the average animal showed slight tumor regression in the combination treatment arm (Fig. 6C).

Antitumor effects of combined MEK and PI3K inhibition in three-dimensional cultures and basal-like in vivo models. A, images of basal-like MDA-MB-231 cells and HER2-amplified BT474 cells on laminin-rich, reconstituted basement membrane in the presence of MEK inhibitor, PI3K inhibitor, or a combination. B, quantitation of three-dimensional culture cell viability in triplicate wells using an ATP-based cell viability assay. A strong combination effect on cell viability is seen in MDA-MB-231 basal-like cells but not in HER2-amplified BT474M1 cells (*, P < 0.005, Student's t test). C, combined MEK and PI3K inhibitor 28-d daily dosing in flank-xenografted MDA-MB-231 basal-like cells showed superior antitumor activity to dosing with either single agent (**, P < 0.0001, Student's t test). Points, mean tumor volume over time of 10 treated animals; bars, SD. Percent tumor growth inhibition is shown to the right of each treatment group and values >100% indicate tumor regression. D, combined MEK and PI3K inhibitor daily dosing in flank-xenografted MX-1 PTEN-null basal-like cells showed superior antitumor activity to dosing with either single agent (**, P < 0.0001, Student's t test). A single dose level of PI3K inhibitor (100 mg/kg) was administered either alone or in combination with two different doses of MEK inhibitor (1.5 or 3 mg/kg).
Antitumor effects of combined MEK and PI3K inhibition in three-dimensional cultures and basal-like in vivo models. A, images of basal-like MDA-MB-231 cells and HER2-amplified BT474 cells on laminin-rich, reconstituted basement membrane in the presence of MEK inhibitor, PI3K inhibitor, or a combination. B, quantitation of three-dimensional culture cell viability in triplicate wells using an ATP-based cell viability assay. A strong combination effect on cell viability is seen in MDA-MB-231 basal-like cells but not in HER2-amplified BT474M1 cells (*, P < 0.005, Student's t test). C, combined MEK and PI3K inhibitor 28-d daily dosing in flank-xenografted MDA-MB-231 basal-like cells showed superior antitumor activity to dosing with either single agent (**, P < 0.0001, Student's t test). Points, mean tumor volume over time of 10 treated animals; bars, SD. Percent tumor growth inhibition is shown to the right of each treatment group and values >100% indicate tumor regression. D, combined MEK and PI3K inhibitor daily dosing in flank-xenografted MX-1 PTEN-null basal-like cells showed superior antitumor activity to dosing with either single agent (**, P < 0.0001, Student's t test). A single dose level of PI3K inhibitor (100 mg/kg) was administered either alone or in combination with two different doses of MEK inhibitor (1.5 or 3 mg/kg).
A second model that emerges from our in vitro studies is that basal-like cell tumors with high levels of Akt signaling driven by PTEN loss have dual activation of both RAS and PI3K/Akt signaling and thus may show enhanced antitumor activity with regimens combining selective MEK and PI3K inhibitors. We tested this hypothesis in flank-implanted tumor xenografts of the basal-like PTEN-null MX-1 cell line challenged with single agent PD0325901, single agent GDC-0941, or a combination of the two agents. We used a single dose level of GDC-0941 (100 mg/kg) and two different dose levels of PD0325901 (1.5 and 3 mg/kg). We first noted that tumor growth inhibition in response to 3 mg/kg 28-day daily dosing in PTEN-null MX-1 cells was only 60%, compared with 97% with this same dose and schedule in MDA-MB-231 cells with intact PTEN (compare Fig. 6C and D). Thus, whereas these models have similar in vitro sensitivity to MEK inhibition, the PTEN-null line is substantially less responsive to in vivo MEK inhibition than the model with intact PTEN, consistent with the hypothesis that PTEN is a negative predictive marker for MEK inhibitor response. In addition, both combination arms showed significantly greater reduction in tumor growth (93% and 98% for the 1.5 and 3 mg/kg groups, respectively) than the single-agent treatment groups, where the best observed response was 60% tumor growth inhibition with 3 mg/kg MEK inhibitor (P < 0.0001, Student's t test). In addition, tumor growth was monitored following cessation of treatment and durable responses were observed for the combination treatment group given 3 mg/kg MEK inhibitor and 100 mg/kg PI3K inhibitor (30% survival, 10% complete regression), but not for other cohorts, at day 40. Given that a concern with combining therapeutics that target these fundamental signaling pathways is the occurrence of overlapping toxicities, it is encouraging to note that in this experiment, the combination was well tolerated and resulted in minimal weight loss (Supplementary Fig. S11). Together, these studies provide strong preclinical support that basal-like breast cancer may provide an opportunity for rational combination therapy with MEK and PI3K inhibitors based on the knowledge of underlying pathway activation status.
Discussion
A key finding of this study is that MEK inhibition selectively affects the viability of basal-like cell lines and primary tumor models compared with other breast cancer subtypes. We have also shown that basal-like cell lines can be further stratified into a subset with low levels of Akt pathway signaling and intact PTEN and a distinct subset with high levels of Akt pathway activation and loss of PTEN, with the latter subset being, on average, less responsive to single-agent MEK inhibition. Previous studies have identified BRAF and KRAS as putative predictive biomarkers for stratifying patients for treatment with selective inhibitors of MEK (10). Our results extend these findings by showing that basal-like breast tumors have similarities at the transcriptional level with RAS-mutant tumors despite an apparent lack of oncogenic mutations and that patients with such tumors may also benefit from treatment with a MEK inhibitor.
Our studies suggest a model in which basal-like cell lines are preferentially sensitive to MEK inhibition due to activation and addiction to the RAS pathway specifically in this subtype. KRAS, RRAS2, HRAS, and BRAF mutations were associated with sensitivity and found only in basal-like breast cancer cell lines, but at a relatively low prevalence (4 of 20 basal-like lines), and thus cannot account for all of the activity seen in basal-like breast cancer. Mutations in RAS and RAF family members also occur at a very low frequency in human breast tumors according to data in the Sanger COSMIC database (BRAF 2%, KRAS 5%, and HRAS 1%), although an examination of the occurrence of mutations across different breast cancer subtypes has not been reported. We used several different bioinformatic approaches that converge on the idea that basal-like breast cancer cell lines and tumors have an overall gene signature that is related to other RAS and EGFR signatures, and our functional studies suggest that, in some cases, RAS activation may be due to signaling through EGFR. This finding agrees with previous results showing that basal-like breast cancers express high levels of EGFR and have an EGFR-like gene expression signature that is predictive of poor prognosis in sporadic tumors (6). However, the overall modest nature of erlotinib response in basal-like breast cancer and our specific functional studies suggest that EGFR alone likely does not account for all of the MEK inhibitor sensitivity observed. These observations are consistent with recent results from a clinical trial (TBCRC 001) in which women with histopathologically confirmed triple-negative breast cancer received the EGFR-targeting monoclonal antibody cetuximab plus carboplatin, where it was observed that EGFR targeted showed clinical benefit in a subset of patients but was insufficient in the majority of women (45). Thus, the exact nature of all of the upstream signals that activate RAS specifically in basal-like cells remains to be determined. Other candidates would include receptor tyrosine kinases that are expressed highly in basal-like cell lines and tumors and compose part of the MEK sensitivity signature such as c-Met and fibroblast growth factor receptor 2, as well as members of the SRC family of nonreceptor tyrosine kinases, because previous studies have shown that the selective SRC inhibitor dasatinib preferentially kills basal-like cell lines (46) and that phosphorylation of SRC family members is associated with in vitro response to a MEK inhibitor (20). Future studies should aim to dissect the relative contribution of different upstream pathways to MEK activation, as well as determine the activating events that lead to receptor tyrosine kinase and RAS activation in basal-like breast cancer. Ultimately, however, because RAS may represent a signal integration point for multiple upstream receptors, the RAS activation signature may provide a more generic picture of pathway activation in basal-like cells, and therapeutics targeting key downstream nodes such as MEK may have broader activity than agents targeting particular upstream receptors.
Mechanistically, MEK inhibition in basal-like tumors has elements in common with the described mechanism of action in BRAF-mutant tumors (10) because we find that MEK inhibition results in G1 arrest, ERK-mediated cyclin D1 down-regulation, and p27 up-regulation in models that show sensitivity to the MEK inhibitor. This observation supports a hypothesis that these cell cycle events are mediating at least some of the antiproliferative effects observed after MEK inhibition and that MEK and ERK activities are required for G1 progression in basal-like breast cancer. These preclinical findings also have potential utility in the clinical development of MEK inhibitors because they suggest that biomarker assays for cyclin D1 and p27 could have utility as early indicators of drug efficacy and facilitate clinical decision making. It is also notable that we did not observe induction of apoptosis or activation of cleaved caspase in response to single-agent MEK treatment in any of the basal-like cell lines except the BRAF-mutant cell line DU4475, suggesting that the mechanism of action of single-agent MEK inhibition in basal-like breast cancer is predominantly cytostatic and not cytotoxic and may be mediated by G1 arrest in response to cyclin D1 down-regulation.
PTEN loss and an activated Akt pathway constitute an apparent intrinsic resistance mechanism to MEK inhibition in basal-like breast cancer because cell lines where PTEN is absent or ablated by siRNA are relatively less sensitive to MEK inhibition than are cells with intact PTEN. Importantly, PTEN loss is common not just in the cell line panel but has also been reported to be frequent and relatively subtype specific in basal-like breast tumors (14). Our PTEN siRNA experiments suggest that PTEN loss does not completely block response, but rather shifts cells upward on a response continuum and renders them less sensitive than they would presumably be without activation of the Akt/PI3K pathway. A hypothesis arising from these results would be that basal-like PTEN-null tumors would be an ideal setting for combining inhibitors that target both MEK and PI3K, and indeed, we observed a strong combination effect in our in vivo experiments with xenografted MX-1 PTEN-null tumors. In addition, our findings may have relevance for rational combination of these agents even in cases of basal-like cancers with intact PTEN and low levels of resting Akt/PI3K pathway activation because we have found that all cell lines examined show evidence of feedback up-regulation of the Akt pathway in response to MEK inhibitor treatment. This phenomenon may suggest an explanation for the lack of apoptosis observed in response to single-agent MEK inhibitor treatment in these cell lines because activation of the Akt pathway mediates antiapoptotic signaling (12), as well as provide a basis for observation that in vitro inhibition of basal-like cell lines does not approach the extreme hypersensitivity observed in BRAF-mutant cell lines. Such feedback regulation and enhanced Akt phosphorylation in response to the MEK inhibitor U0126 has been described previously (47) and shown to involve ERK-driven regulation of the interaction between EGFR and Gab1 serving to down-regulate PI3K signaling. Thus, both the presence of constitutive Akt activation due to PTEN loss and the feedback up-regulation of pAkt by single-agent MEK inhibition suggest a rationale for combined targeting of MEK and PI3K in basal-like breast cancer. The synergistic effects on cell viability in basal-like cell lines may also involve effects on cell cycle progression as well as enhanced apoptosis because we found that cotreatment with both MEK and PI3K inhibitors resulted in more substantial down-regulation of cyclin D1 than did either single agent in CAL85-1 basal-like cells that showed in vitro synergy. Thus, one facet of the synergistic in vitro effects of MEK and PI3K inhibitors may be the convergence of the two pathways on cyclin D1 regulation. Somewhat surprisingly, because it might be assumed that combining MEK and PI3K inhibitors would always be superior to single-agent treatment based on the fundamental importance of these signaling pathways, our in vitro experiments and three-dimensional culture experiments suggest that dramatic combination effects may be limited to cell lines of the basal-like subtype. Luminal and HER2-amplified cell lines do not have apparent activation and dependence on the RAS pathway or potential to respond to MEK inhibition by engaging the cell cycle machinery, and thus do not seem to benefit from the addition of a MEK inhibitor to a PI3K inhibitor. However, based on the studies reported here and by others (48), as well as the frequent occurrence of oncogenic mutations in PIK3CA we observe in cell lines, luminal and HER2-amplified tumors may respond well to single-agent PI3K inhibition. A recent study suggested that a combination regimen with MEK and PI3K inhibitors might effectively be used to treat KRAS-mutant lung tumors (49), and our studies suggest that such an approach might be similarly fruitful in basal-like breast cancers with both intact and deleted PTEN.
Breast cancer has emerged as a model for personalized medicine based on molecular tumor characterization because clinical management of disease involves routine evaluation of diagnostics tests before treatment with hormonal therapy or HER2 targeting agents such as trastuzumab (Herceptin) or lapatinib (Tykerb). The results reported here as well as previous studies (11) suggest that large panels of breast cancer cell lines represent much of the genetic and transcriptional diversity seen in primary tumors and hence may be useful surrogates to develop preclinical hypotheses around molecular determinants of drug response that can then be tested during clinical development. The results reported here show that a selective inhibitor of MEK kinase primarily has activity in the basal-like subtype of breast cancer and hence provides a strategy for patient stratification during clinical trials for MEK inhibitors. Moreover, clinical studies focusing on single-agent MEK inhibitor activity have thus far not shown much evidence of clinical benefit resulting from targeting MEK alone (26), and the clinical challenges experienced in the development of MEK inhibitors have led others to suggest that the future development of MEK inhibitors as anticancer agents may require rational combinations of agents (50). Our results suggest that the combination of MEK and PI3K inhibitors in basal-like breast cancer may represent a useful avenue for such future clinical investigation.
Disclosure of Potential Conflicts of Interest
All authors are either current or former employees of Genentech.
The costs of publication of this article were defrayed in part by the payment of page charges. This article must therefore be hereby marked advertisement in accordance with 18 U.S.C. Section 1734 solely to indicate this fact.
Note: Supplementary data for this article are available at Clinical Cancer Research Online (http://clincancerres.aacrjournals.org/).
K. Hoeflich, C. O'Brien, and Z. Boyd contributed equally to this work.
Acknowledgments
We thank David Dornan, Richard Neve, David Stokoe, David Davis, Ellen Filvaroff, and Elaine Storm for critically reviewing the manuscript, Somasekar Seshagiri, Fred de Sauvage, and the Cancer Genome project for mutational analyses and support, and the Genentech Medicinal Chemistry Group for providing GDC-0941.