


Abstract
Purpose: To optimally integrate epidermal growth factor receptor (EGFR) inhibitors into the clinical treatment of head and neck cancer, two important questions must be answered: (a) does EGFR inhibition add to the effects of radiochemotherapy, and (b) if so, which method of inhibiting EGFR is superior (an EGFR antibody versus a small molecule tyrosine kinase inhibitor)? We designed an in vivo study to address these questions.
Experimental Design: Nude mice with UMSCC-1 head and neck cancer xenografts received either single, double, or triple agent therapy with an EGFR inhibitor (either cetuximab or gefitinib), gemcitabine, and/or radiation for 3 weeks. Tumor volumes and animal weights were measured for up to 15 weeks. Immunoblotting and immunofluorescent staining were done on tumors treated with either cetuximab or gefitinib alone.
Results: The addition of an EGFR inhibitor significantly delayed the tumor volume doubling time, from a median of 40 days with radiochemotherapy (gemcitabine and radiation) alone, to 106 days with cetuximab and 66 days with gefitinib (both P < 0.005). Cetuximab resulted in significantly less weight loss than gefitinib. Immunoblot analysis and immunofluorescent staining of tumors show that although levels of phosphorylated AKT and extracellular signal–regulated kinase were decreased similarly in response to cetuximab or gefitinib, cetuximab caused prolonged suppression of pEGFR, pSTAT3, and BclXL compared with gefitinib.
Conclusions: EGFR inhibition, particularly with cetuximab, improves the effectiveness of radiochemotherapy in this model of head and neck cancer. The correlation of response with prolonged suppression of EGFR, STAT3, and BclXL offers the possibility that these may be candidate biomarkers for response.
The epidermal growth factor receptor (EGFR) is overexpressed in a wide variety of solid tumors, including 80% to 90% of squamous cell carcinomas of the head and neck. High tumor EGFR levels have been associated with aggressive clinical features in a number of malignancies; in head and neck cancers, these characteristics include decreased survival, advanced stage, increased tumor size, decreased radiosensitivity, and increased risk of recurrence (1, 2). On a molecular level, EGFR activation results in the initiation of key intracellular signaling pathways that promote malignant behavior, including survival, proliferation, and cell cycle progression. Given its correlation with poor clinical outcome and its role in oncogenic transformation, activated EGFR has emerged as a leading target in anticancer therapy, encouraging the development of monoclonal antibodies and low–molecular weight tyrosine kinase inhibitors (TKI) specifically directed against the receptor.
Although there is a strong rationale for therapy based on EGFR inhibition, monotherapy with EGFR inhibitors has met with only limited success, with response rates between 5% and 15% in recurrent or metastatic head and neck cancer (3, 4). Therefore, EGFR inhibitors are now being combined on an empirical basis with chemotherapy and/or radiation therapy. The best validation of this combination approach comes from a recent phase III clinical trial which showed that the addition of the EGFR antibody cetuximab (C225, Erbitux) to radiotherapy increased the median survival of patients with locally advanced head and neck cancer from 28 months, produced by radiation alone, to 54 months (5). This impressive improvement has raised the question of how to combine EGFR inhibitor therapy with the current standard of care for advanced head and neck cancer: the combination of radiation and conventional cytotoxic chemotherapy. Indeed, a randomized clinical trial (RTOG 0522) is now under way to assess the addition of EGFR antagonists to radiochemotherapy.
Although it is logical to combine EGFR-inhibiting therapy with radiochemotherapy, little preclinical evidence is available to aid in optimizing this strategy (6). In order to integrate EGFR inhibitors most effectively into the clinical treatment of head and neck cancer, it would seem desirable to know (a) whether EGFR inhibition adds to the effects of radiochemotherapy, in addition to the previously shown radiotherapy alone, and (b) which method of inhibiting EGFR is superior (an EGFR antibody versus a small molecule TKI). We decided to approach the first question by using the deoxycytidine analogue gemcitabine. We have previously established that gemcitabine is an effective radiosensitizer and cytotoxic agent for squamous cell carcinomas of the head and neck in both preclinical studies and clinical trials (7–11). To answer the second question, we compared responses of head and neck tumor xenografts to the TKI gefitinib and the antibody cetuximab, alone or in combination with radiation or radiochemotherapy. Upon discovering differences in tumor response to gefitinib versus cetuximab, we investigated variations in signaling molecules downstream of EGFR to elucidate possible mechanisms for the therapeutic differences between these two types of EGFR inhibitors.
Materials and Methods
Cell culture. The human head and neck squamous carcinoma cell line UMSCC-1 was obtained courtesy of Dr. Thomas E. Carey (University of Michigan, Ann Arbor, MI). Experimental conditions for cell culture were maintained as previously described (8).
Reagents. Gemcitabine was provided by Eli Lilly and Co. (Indianapolis, IN), gefitinib was provided by AstraZeneca (Macclesfield, Cheshire, United Kingdom), and cetuximab was provided by Imclone (New York, NY). Phosphorylated EGFR (Y845 and Y992), phosphorylated AKT (Ser473), total AKT, phosphorylated extracellular signal–regulated kinase (ERK; Thr202/Y204), total ERK, phosphorylated signal transducer and activator of transcription 3 (pSTAT3), and total STAT3 antibodies were obtained from Cell Signaling (Danvers, MA). Total EGFR (sc-03) and Bcl-xS/L (sc-634) antibodies were obtained from Santa Cruz Biotechnology (Santa Cruz, CA). Glyceraldehyde-3-phosphate dehydrogenase antibody was purchased from Abcam (Cambridge, MA).
In vivo tumor growth studies. Mice were handled according to the established procedures of the University of Michigan Laboratory Animals Maintenance Manual. To generate tumor xenografts, 5 × 10⁶ UMSCC-1 cells were transplanted into the flanks of athymic nude Foxn1nu mice (Harlan Laboratories, Indianapolis, IN). When tumors reached a volume of ∼100 mm3, the mice were randomized into 12 groups (1 untreated control and 11 experimental groups, each with 11-14 tumors), and treatment was initiated. Each of the experimental groups received either single, double, or triple agent therapy with an EGFR inhibitor, gemcitabine, and/or radiation. Groups receiving an EGFR inhibitor received either cetuximab or gefitinib. All treatments were given for a total of 3 weeks. Gemcitabine was dissolved in 0.9% sodium chloride and given via i.p. injection on day 1 weekly (days 1, 8, and 15) at a dose of 300 mg/kg. Gefitinib was dissolved in water containing 1% Tween 80 (Sigma Aldrich, St. Louis, MO) and given via oral gavage on days 2 to 6 weekly (days 2-6, 9-13, and 16-20) at a dose of 100 mg/kg. Cetuximab was provided as an aqueous solution of 2 mg/mL and was given via i.p. injection on days 2 and 5 weekly (days 2, 5, 9, 12, 16, and 19) at a dose of 50 mg/kg. Radiation therapy was administered as 2 Gy fractions on days 1 to 5 weekly (days 1-5, 8-12, and 15-19), at 6 h after the administration of gemcitabine or an EGFR inhibitor. Lead shielding was provided for the intra-abdominal organs. Radiation therapy was done at a dose rate of 1 to 2 Gy/min at room temperature using an Orthovoltage Unit Pantak (East Haven, CT) DXT 300 producing 300 kV X-rays. Tumor dimensions and animal weights were measured twice or thrice weekly, up to 15 weeks after treatment. Certain treatment groups were sacrificed prior to 15 weeks due to either tumor size or based on recommendations of the University of Michigan Laboratory Animals Maintenance representatives to minimize animal morbidity. Tumor volume was calculated according to the equation for a prolate spheroid: tumor volume = (π/6) × (L × W2), where L and W are the longer and shorter dimensions of the tumor, respectively. Data are expressed as the ratio of tumor volume at various times after treatment compared with the first day of treatment (day 0).
Immunoblotting and immunofluorescence. For immunoblotting and immunofluorescence studies, UMSCC-1 tumor xenografts were generated as described above and randomized into three treatment groups. One group served as the untreated control group; the remaining two groups received either a 1-week treatment of gefitinib (100 mg/kg via oral gavage on days 2-6) or cetuximab (50 mg/kg via i.p. injection on days 2 and 5). Tumors were harvested either at the end of the 1-week treatment (day 8) or 1 week after the cessation of therapy (day 15), with five to seven samples per treatment group per time point. For immunoblotting, tumors were snap-frozen in liquid nitrogen. Samples were processed and immunoblotting was done as described previously (8). For immunostaining, tumors were harvested, fixed in formalin for 24 h, stored in 70% ethanol, and stained as described previously (12).
Statistical analysis. For the analysis of tumor xenograft response to therapy, two specific events were measured: the duration of a 50% decrease in tumor volume from baseline (the “objective response” outcome) and the time to double the tumor volume (“treatment failure”). For the “response” outcome, the presence or absence of the outcome for each tumor was assessed, and the statistical significance of pairwise comparisons between treatment groups was evaluated by Fisher exact test. The duration of response was reported as the last day of response (e.g., the last day the tumor volume was less than or equal to one-half of the volume on day 0) minus the first day of response; a zero duration of response was recorded for tumors that did not shrink. The statistical significance of bivariate comparisons of response duration was assessed by exact Wilcoxon tests. The statistical significance of pairwise comparisons of “treatment failure” as a dichotomous outcome was assessed by Fisher exact test, where the time to failure was defined as the first day the tumor volume was twice baseline volume. The time to treatment failure was characterized by Kaplan-Meier (product-limit) estimates; pairwise comparisons of time-to-event functions were evaluated by the Wilcoxon test. All statistical analyses were done using SAS v9.1.3 (SAS Institute, Inc., Cary, NC).
Results
Tumor growth studies. We first determined the doses of EGFR inhibitors that result in extended suppression of EGFR phosphorylation in UMSCC-1 xenografts. We have previously shown that administering gefitinib at a concentration of 100 mg/kg via oral gavage for 5 consecutive days causes prolonged inhibition of EGFR phosphorylation after the cessation of treatment (8). To achieve similar effects, we selected a cetuximab dose of 50 mg/kg via i.p. injection twice a week based on pharmacologic studies showing that this regimen produces stable blood levels of antibody capable of effective EGFR inhibition in xenograft models (13). We did initial studies showing that these doses of gefitinib and cetuximab resulted in comparable levels of EGFR suppression in UMSCC-1 xenografts at the end of 1 week of treatment (Fig. 3).3
Unpublished results.
We then conducted experiments to test our hypothesis that the addition of an EGFR inhibitor would increase the therapeutic efficacy of radiochemotherapy, defined as the combination of gemcitabine and radiation (Fig. 1A). We focused on two aspects of tumor response for further analysis: the tumor volume doubling time and the duration of tumor shrinkage (as defined in Materials and Methods). We found that the addition of either cetuximab or gefitinib to radiochemotherapy significantly increased the tumor volume doubling time compared to treatment with radiochemotherapy alone, from a median doubling time of 40 to >106 days (P = 0.0004; with cetuximab) or 66 days (P = 0.005; with gefitinib; Fig. 1B). Furthermore, although the addition of cetuximab to radiochemotherapy significantly increased the duration of tumor shrinkage compared with radiochemotherapy alone (from a median duration of 0 days, indicating that most tumors did not shrink sufficiently to qualify as a response, to 91 days; P < 0.0001), the addition of gefitinib to radiochemotherapy did not result in significantly longer median tumor shrinkage (from 0 to 3 days; P = 0.22; Supplemental Fig. S1).
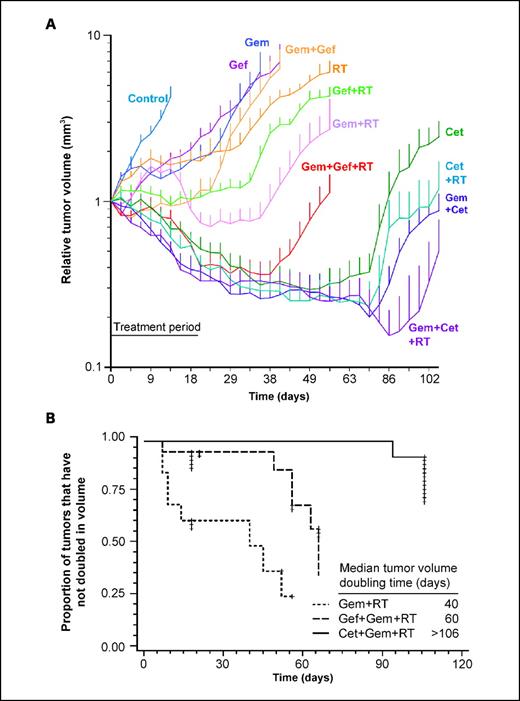
Effect of EGFR inhibition and radiochemotherapy on UMSCC-1 xenograft growth. Athymic nude mice bearing UMSCC-1 xenografts were treated with either single, double, or triple agent therapy with an EGFR inhibitor (either cetuximab or gefitinib), gemcitabine, and/or radiation for 3 wks, as described in Materials and Methods. A, the relative tumor volume as a function of time is depicted for each treatment group (bars, SE at each measurement point). B, Kaplan-Meier curves show the effects of adding either cetuximab or gefitinib to radiochemotherapy (defined as gemcitabine and radiation) on tumor volume doubling time. The median tumor volume doubling time for each group is depicted numerically.
Effect of EGFR inhibition and radiochemotherapy on UMSCC-1 xenograft growth. Athymic nude mice bearing UMSCC-1 xenografts were treated with either single, double, or triple agent therapy with an EGFR inhibitor (either cetuximab or gefitinib), gemcitabine, and/or radiation for 3 wks, as described in Materials and Methods. A, the relative tumor volume as a function of time is depicted for each treatment group (bars, SE at each measurement point). B, Kaplan-Meier curves show the effects of adding either cetuximab or gefitinib to radiochemotherapy (defined as gemcitabine and radiation) on tumor volume doubling time. The median tumor volume doubling time for each group is depicted numerically.
Because treatment with cetuximab alone was so effective, we decided to analyze our data to ask the converse question to that stated above: did the addition of radiotherapy and/or chemotherapy to EGFR inhibition improve the result over those obtained with EGFR inhibition alone. The combination of cetuximab and radiochemotherapy (but not radiation or chemotherapy alone) showed a trend towards increased duration of tumor shrinkage compared with cetuximab alone (P = 0.08; Supplemental Fig. S1). Similarly, the addition of radiochemotherapy (but not radiation or chemotherapy alone) significantly increased the duration of tumor shrinkage compared with gefitinib alone (P = 0.0044; Supplemental Fig. S1). Overall, the combination of cetuximab, gemcitabine, and radiation was the most effective therapy, resulting in a median tumor volume doubling time of >106 days, and a median duration of tumor shrinkage of 91 days.
We next evaluated the effect of EGFR inhibitor class on therapeutic efficacy by comparing tumor response to cetuximab versus gefitinib. The median tumor doubling time was 98 days in response to cetuximab alone, versus 16 days following treatment with gefitinib alone (P < 0.0008 on Kaplan-Meier analysis; Fig. 2A). When combined with gemcitabine, radiation, or both, treatment with cetuximab significantly increased the tumor volume doubling time compared with analogous groups with gefitinib (P < 0.002 for all comparisons on Kaplan-Meier analysis; Fig. 2B-D). Treatment with cetuximab, either alone or in combination with gemcitabine, radiation, or both, also resulted in a significantly longer duration of tumor shrinkage compared with analogous groups receiving gefitinib (Supplemental Fig. S1; P is at least < 0.0005).
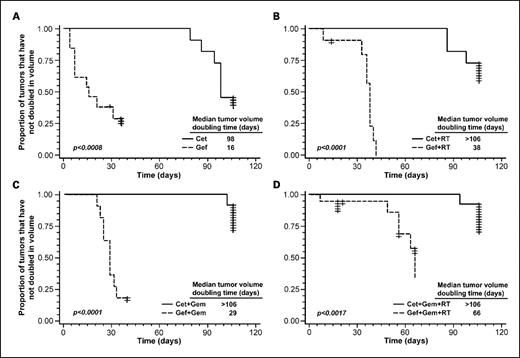
Effect of cetuximab versus gefitinib, alone or in combination with radiochemotherapy, on tumor volume doubling time. Kaplan-Meier curves compare the effects on tumor volume doubling time of treatment with cetuximab versus gefitinib, either as a single agent (A), or in combination with radiation (B), gemcitabine (C), or both (D). Differences between each set of Kaplan-Meier curves are assessed using the Fisher exact test. The median tumor volume doubling time for each group is also depicted numerically.
Effect of cetuximab versus gefitinib, alone or in combination with radiochemotherapy, on tumor volume doubling time. Kaplan-Meier curves compare the effects on tumor volume doubling time of treatment with cetuximab versus gefitinib, either as a single agent (A), or in combination with radiation (B), gemcitabine (C), or both (D). Differences between each set of Kaplan-Meier curves are assessed using the Fisher exact test. The median tumor volume doubling time for each group is also depicted numerically.
Effect of EGFR inhibitors on downstream effectors. In order to understand the increased effectiveness of cetuximab compared with gefitinib, we evaluated therapy-induced differences in the expression levels of proteins involved in the EGFR signaling cascade. Immunoblot analysis was done on UMSCC-1 tumor xenografts treated with 1 week of cetuximab or gefitinib. At the end of the 1-week treatment, both cetuximab- and gefitinib-treated tumors showed similar degrees of inhibition of phosphorylated EGFR, ERK, and STAT3, without marked suppression of phosphorylated AKT (Fig. 3). Although total EGFR levels were decreased in cetuximab-treated tumors compared with those receiving gefitinib, levels of total ERK, STAT3, and AKT were not significantly different between the two treatment groups and control samples. This suggested that the difference between gefitinib and cetuximab did not derive from differences in short-term effects.
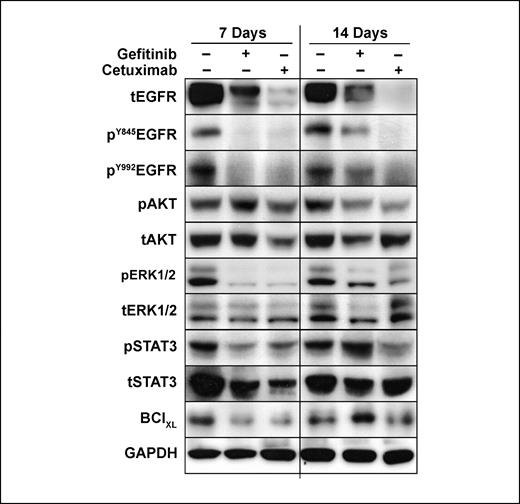
Effect of EGFR inhibition by cetuximab versus gefitinib on the expression level of proteins involved in the EGFR signaling cascade. Levels of total and phosphorylated EGFR, AKT, ERK, and STAT3, as well as BclXL, are shown at the end of a 1-wk treatment of either cetuximab or gefitinib (7-d time point), or following an additional week of no treatment (14-d time point), as described in Materials and Methods. Glyceraldehyde-3-phosphate dehydrogenase (GAPDH) levels are provided as a loading control.
Effect of EGFR inhibition by cetuximab versus gefitinib on the expression level of proteins involved in the EGFR signaling cascade. Levels of total and phosphorylated EGFR, AKT, ERK, and STAT3, as well as BclXL, are shown at the end of a 1-wk treatment of either cetuximab or gefitinib (7-d time point), or following an additional week of no treatment (14-d time point), as described in Materials and Methods. Glyceraldehyde-3-phosphate dehydrogenase (GAPDH) levels are provided as a loading control.
We next determined whether there were differences in the long-term effects in response to cetuximab versus gefitinib by evaluating protein expression 1 week after the cessation of a 1-week course of therapy. At this later time point, cetuximab treatment resulted in much greater suppression of EGFR phosphorylation than gefitinib; in fact, phosphorylated EGFR levels in gefitinib-treated samples did not differ markedly from time-matched controls (Fig. 3). Whereas levels of the downstream effectors pAKT and pERK did not differ in response to the different EGFR inhibitors, cetuximab therapy resulted in more prolonged inhibition of phosphorylated STAT3 compared with gefitinib treatment. Because of the observed differences in phosphorylated STAT3 levels, we evaluated the expression of the antiapoptotic molecule BclXL, which is transcriptionally regulated by STAT3. Cetuximab resulted in more prolonged suppression of BclXL levels compared with gefitinib, similar to the pattern of STAT3 inhibition.
Immunofluorescent analysis of the same tumor samples confirmed that the cetuximab treatment caused more prolonged EGFR and STAT3 inhibition than gefitinib (Fig. 4). Additionally, cetuximab-treated tumors exhibited decreased staining of the proliferation marker Ki67 and similar terminal nucleotidyl transferase–mediated nick end labeling staining (TUNEL) compared with gefitinib-treated tumors.
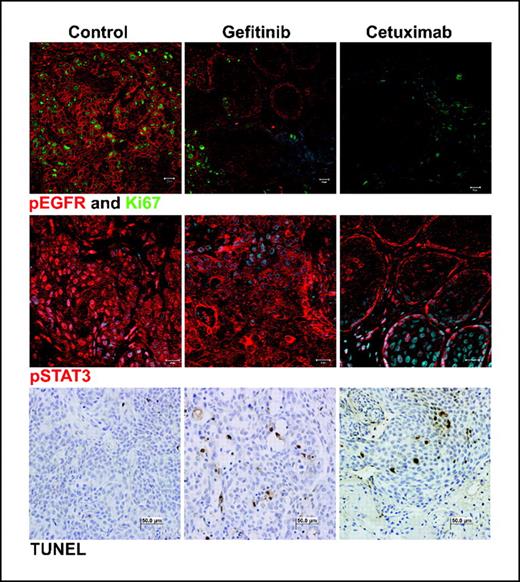
Differences in tissue staining of gefitinib- and cetuximab-treated tumors. Mice were treated with 1 wk of cetuximab or gefitinib, and tumors were harvested after an additional week of no treatment. These samples were then stained for phosphorylated EGFR (top row, red), Ki67 (top row, green), phosphorylated STAT3 (middle row, red), or terminal nucleotidyl transferase–mediated nick end labeling (bottom row).
Differences in tissue staining of gefitinib- and cetuximab-treated tumors. Mice were treated with 1 wk of cetuximab or gefitinib, and tumors were harvested after an additional week of no treatment. These samples were then stained for phosphorylated EGFR (top row, red), Ki67 (top row, green), phosphorylated STAT3 (middle row, red), or terminal nucleotidyl transferase–mediated nick end labeling (bottom row).
Treatment toxicity. In addition to evaluating the efficacy of treatment, we also wished to assess toxicity. Mice receiving only cetuximab or gefitinib experienced only minimal toxicity and gained weight over the course of treatment, without significant differences compared with the control group (Fig. 5). However, mice treated with an EGFR inhibitor in combination with radiation or radiochemotherapy manifested greater side effects, losing weight over the course of treatment. Of interest, all groups treated with gefitinib exhibited greater weight loss than corresponding groups with cetuximab; these differences were significant when gefitinib/cetuximab was combined with gemcitabine, radiation, or both (P < 0.05).
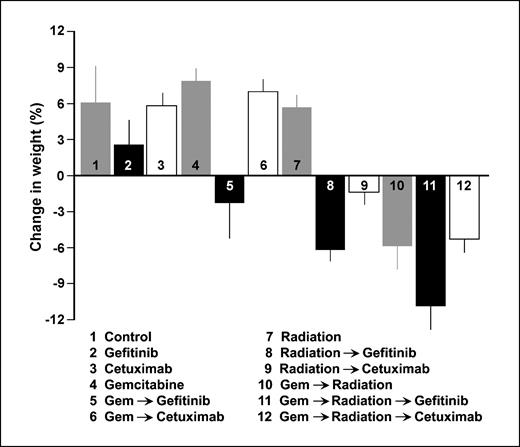
Average relative weight change per treatment group at the end of treatment. Mouse weight at the end of the 3-wk treatment course is expressed as a percentage of change in weight (average ± SE) compared with initial pretreatment weight.
Average relative weight change per treatment group at the end of treatment. Mouse weight at the end of the 3-wk treatment course is expressed as a percentage of change in weight (average ± SE) compared with initial pretreatment weight.
Discussion
In this study, we have found that the addition of an EGFR inhibitor to radiochemotherapy significantly improves tumor response. In addition, we have found that EGFR inhibitor class significantly affects the therapeutic index of combined and single modality treatment in this head and neck cancer xenograft model. Specifically, the monoclonal anti-EGFR antibody cetuximab resulted in better tumor response, as measured by tumor volume doubling time and duration of shrinkage, compared with the EGFR TKI gefitinib, likely due to more prolonged suppression of EGFR, STAT3, and BclXL. Additionally, cetuximab was less toxic, as measured by weight loss compared with gefitinib.
The differences in duration of EGFR inhibition seen in this study may reflect, at least in part, differences in pharmacokinetics of anti-EGFR antibodies versus TKIs. Whereas the doses of EGFR inhibitors used in this study represent standard in vivo doses, the pharmacokinetics of cetuximab and gefitinib have not been well characterized in nude mice. However, one can extrapolate concepts from the known clinical pharmacokinetic variables of these drugs. Clinical treatment of head and neck cancer with i.v. cetuximab typically consists of a loading dose of 400 mg/m2 followed by four weekly maintenance doses of 250 mg/m2; based on a phase I study, the half-life of cetuximab ranges from 75 to 188 h, with a mean half-life of 114 h at doses of 200 or 400 mg/m2 (15, 16). Clinical studies using gefitinib in head and neck cancer treatment typically used oral doses of 500 mg/d (3); phase I data indicate that, over a dose range of 100 to 700 mg/d over multiple consecutive days, the half-life of gefitinib ranges from 37 to 65 h, with a mean half-life across all dose levels of 48 h (17). Thus, it seems possible that the longer half-life of cetuximab may result in the more extended suppression of EGFR compared with gefitinib in patients as well. Of note, cetuximab was given via injection and gefitinib was delivered orally in this study in attempts to mimic the clinical delivery of these agents.
Factors in addition to pharmacokinetic and dynamic molecular distinctions at the tissue level may play an important role in differences between antibodies and TKIs. Although both inhibitor classes block EGFR activation and thus suppress downstream signaling, their mechanisms do not overlap completely (18). As opposed to TKIs, anti-EGFR antibodies can induce receptor internalization as well as elicit antibody-dependent cellular cytotoxicity (18–21). Both of these characteristics have implications for long-term EGFR down-regulation and may contribute to the prolongation of EGFR suppression achieved by cetuximab versus gefitinib, although this latter mechanism is unlikely to be active in the immunocompromised model used in this study. TKIs have a potential advantage relative to antibodies through their ability to induce the formation of inactive EGFR/HER2 heterodimers, thus impairing both pathways (18, 22). TKIs are effective in 15% to 20% of patients with non–small cell lung cancers with specific mutations in the ATP binding pocket, but such mutations are rare in head and neck cancer.
The present study also suggested that the toxicity profile may be important when selecting an EGFR inhibitor. The weight loss seen in this study, which was greater in animals treated with gefitinib than with cetuximab, was likely secondary to gastrointestinal toxicity because the oral administration of gefitinib and other TKIs has previously been associated with dose-limiting gastrointestinal toxicities (23, 24). On the other hand, because cetuximab and other antibodies are delivered i.v. (or i.p.) and do not enter the lumen of the gastrointestinal tract, they do not seem to induce significant diarrhea (24, 25). Ultimately, the toxicities that are more common to TKIs, such as diarrhea and interstitial lung disease, must be weighed against antibody-specific toxicities, such as infusion reactions and hypomagnesemia (26).
An unexpected result of this study was that tumor suppression in the group receiving cetuximab and radiochemotherapy was only marginally superior to the group receiving cetuximab alone. It is possible that cetuximab alone was so effective in this cell line that further therapeutic gain with the addition of other agents would be difficult to achieve. In larger clinical trials which include a heterogeneous population of tumors with varying EGFR levels, the addition of chemoradiation to cetuximab may have a more significant effect, especially in tumors not as strongly driven by EGFR signaling.
Although EGFR inhibitors may provide a therapeutic gain in cancer therapy, predictive markers of response still need to be investigated. Because several studies have shown a poor correlation between suppression of EGFR phosphorylation in tumors and their sensitivity to EGFR inhibitors, it has been suggested that changes in target-dependent downstream markers may correlate better with clinical benefit by accounting for variability in EGFR dependence between tumors (27). However, no single downstream effector has been consistently identified as a good predictor of EGFR inhibitor sensitivity; multiple markers may be necessary to foretell response (28). Although ERK and AKT activation have been the most investigated candidates, STAT3 phosphorylation represents an especially promising marker in head and neck cancer because increased tumor levels of phosphorylated STAT3 have been associated with lower survival rates (29). In addition, it has been shown that EGFR-mediated growth of transformed squamous epithelial cells depends on STAT3 activation, and STAT3 suppression inhibits this growth (2). Furthermore, STAT3 is critical in oncogenesis because it controls the expression of several genes involved in survival, including BclXL (30); disruption of STAT3 signaling in head and neck cancer inhibits BclXL expression as well as the induction of apoptosis (31). However, the lack of difference we found between cetuximab and gefitinib in the fraction of cells undergoing apoptosis suggests that apoptosis alone is unlikely to predict response.
Our results suggest that phosphorylated STAT3 and BclXL should be evaluated as predictive markers of EGFR inhibitor sensitivity. Given the association between persistent suppression of STAT3/BclXL signaling and therapeutic response to EGFR inhibitors, STAT3 and BclXL also merit consideration as additional molecular targets in head and neck cancer. In fact, combined inhibition of EGFR and STAT3 has been shown to yield better therapeutic response than inhibition of either molecule alone (32). Inhibitors of BclXL have also shown antitumor activity in preclinical head and neck cancer models (33); the combination of EGFR and BclXL inhibitors may yield further therapeutic gain as well.
Although our study shows that the addition of an EGFR inhibitor to radiochemotherapy improves tumor response, it also highlights areas that need to be further addressed clinically. Although cetuximab is superior to gefitinib in our model system, further preclinical and clinical studies will be required to optimize the integration of EGFR inhibitors with radiochemotherapy. Additionally, the utility of STAT3 and BclXL activation as predictive factors of EGFR inhibitor sensitivity needs to be confirmed in patient samples. The combination of cetuximab with radiochemotherapy as first-line therapy for head and neck squamous cell carcinoma is now being assessed in a multi-institutional RTOG clinical trial. We hope that further investigation in this area will eventually allow us to tailor EGFR inhibitor choice and use accurate predictive markers to individualize care for each patient.
Grant support: NIH through the University of Michigan Head and Neck Specialized Program of Research Excellence grant 1 P50 CA97248 and University of Michigan Cancer Center support grant 5 P30 CA46592.
The costs of publication of this article were defrayed in part by the payment of page charges. This article must therefore be hereby marked advertisement in accordance with 18 U.S.C. Section 1734 solely to indicate this fact.
Note: Supplementary data for this article are available at Clinical Cancer Research Online (http://clincancerres.aacrjournals.org/).
Acknowledgments
We thank Avraham Eisbruch for helpful discussions and Steven Kronenberg for assistance in making figures.